A senior suffers from memory loss due to dementia. /CFP
A senior suffers from memory loss due to dementia. /CFP
Chinese experts have developed a novel dementia risk prediction model that can predict dementia within five, 10, and even much longer years.
Based on the UK Biobank (UKB), a large-scale biomedical database, the research team followed up 425,159 non-dementia people aged 40-69. During the median follow-up of 11.9 years, 5,287 and 2,416 participants developed incident dementia and Alzheimer's Disease, respectively.

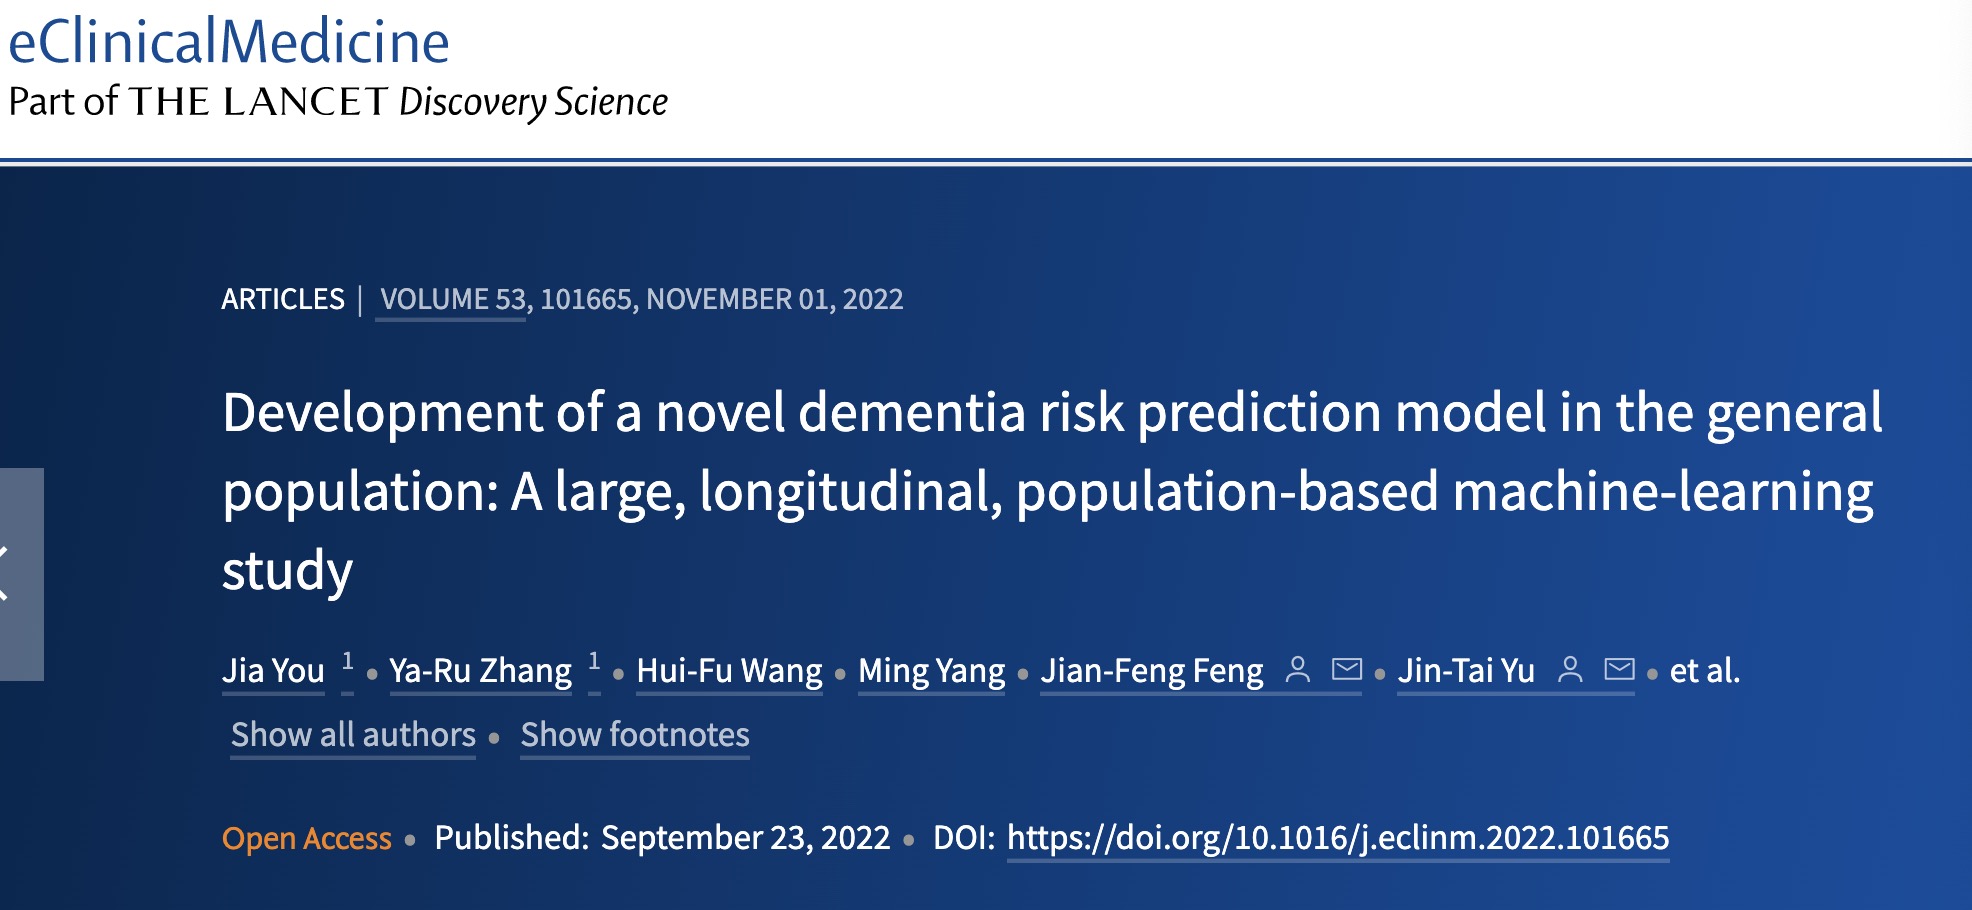
A screenshot of the study published in the journal EClinicalMedicine of The Lancet. /EClinicalMedicine
A screenshot of the study published in the journal EClinicalMedicine of The Lancet. /EClinicalMedicine
In the study, researchers implemented a data-driven strategy to identify predictors from 366 candidate variables covering a comprehensive range of genetic and environmental factors.
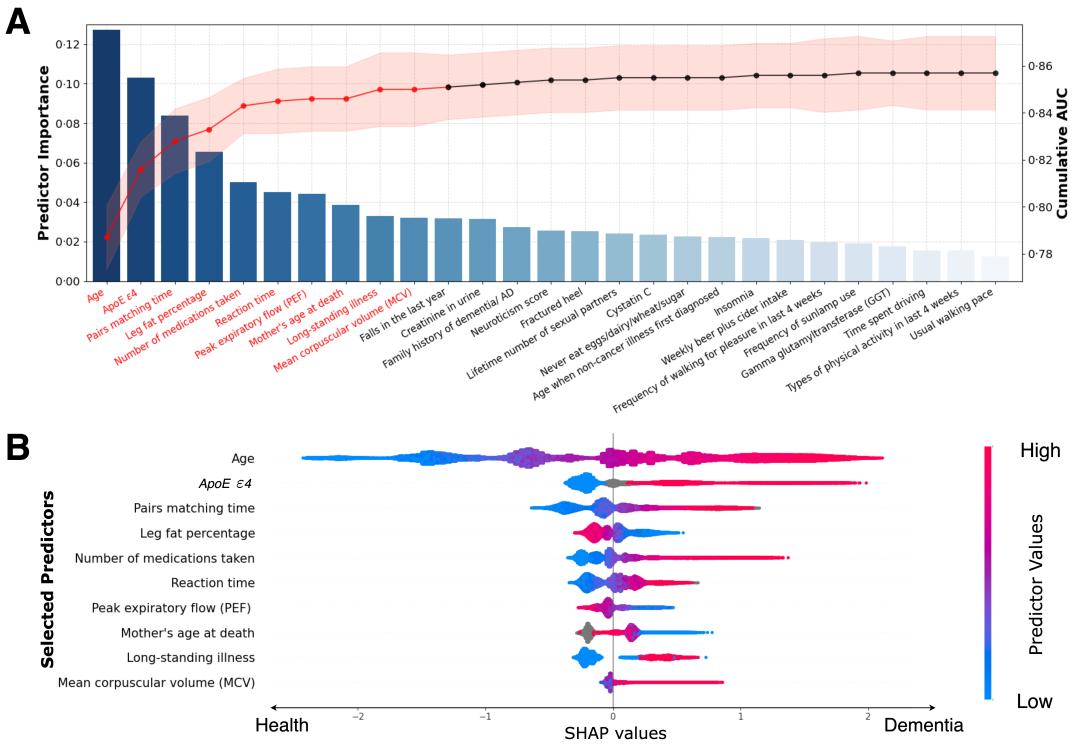
They then used a machine learning algorithm to calculate the importance of each predictor to the dementia prediction model, selected the top 10 predictors, and constructed a novel dementia risk prediction model called UKB-DRP.

An illustration of predictor selection and SHAP visualisation of modelling on all incident dementia population. (A) Sequential forward selection from pre-selected candidate predictors. The bar chart represented the sorted predictor importance based on their contributions to model classifications. The line chart delineated cumulative AUCs (right axis) upon the inclusion of predictors one by each iteration. Top-10 predictors (colored in red) were finally selected for ML model building. (B) SHAP visualisation plot of selected predictors. The width of the range of horizontal bars can be interpreted as the impact on the model prediction that the wider its range, the larger its impact. The color of the horizontal bars represented the magnitude of predictors, which was coded in a gradient from blue (low) to red (high), shown as the color bar on the right-hand side. The directions on the x-axis represented the likelihood of developing dementia (right) or being healthy (left). Readers can then infer the possibility
of developing dementia given each predictor's specific value (coded in a gradient of colors).
Abbreviations: SHAP = SHapley Additive exPlanations, ApoE e4= Apolipoprotein E (ApoE) e4. /EClinicalMedicine
The top 10 predictors include age, gene, pairs matching time, leg fat percentage, number of medications taken, reaction time, peak expiratory flow, mother's age at death, long-standing illness, and mean corpuscular volume.
The advantage of the UKB-DRP model is that the 10 predictors can be quickly obtained from the questionnaire survey, simple physical examination, and routine blood test, said Yu Jintai, a professor at the Fudan University-affiliated Huashan Hospital.

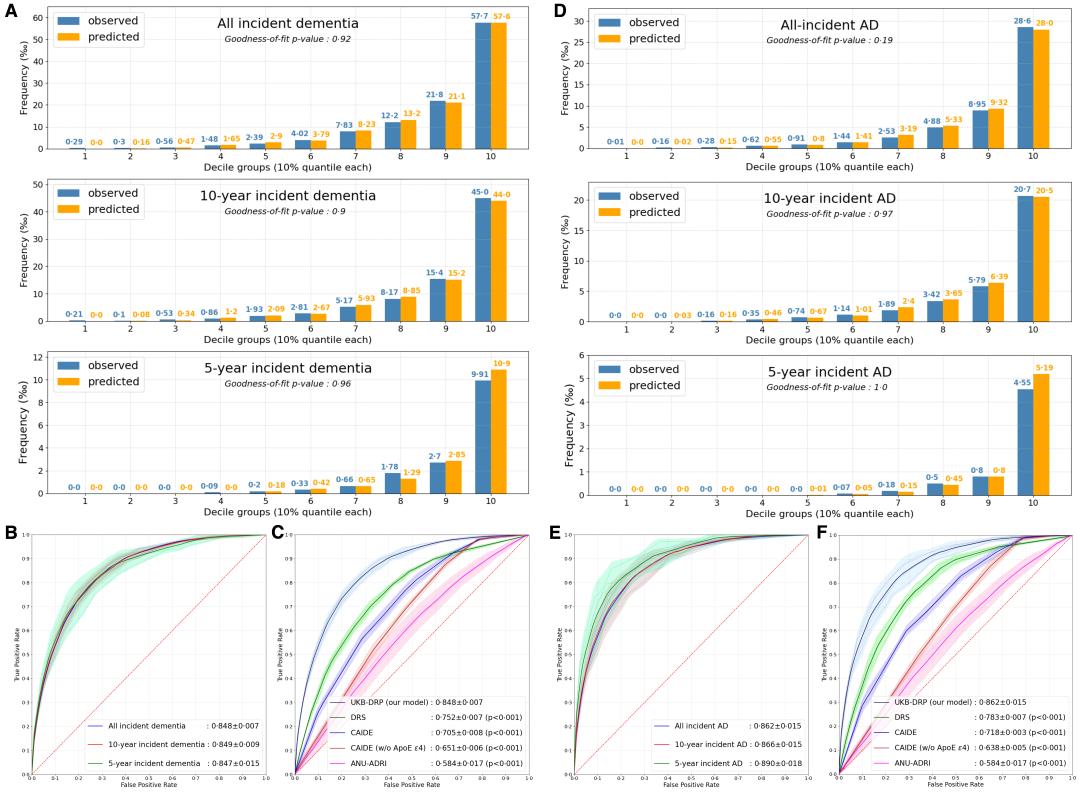
An illustration of performance of the UKB-DRP and existing prediction scales. (A) Calibration plots of the UKB-DRP on dementia at different incident times.
(B) AUC plots of the UKB-DRP on dementia at different incident times.
(C) AUC plots of the UKB-DRP and existing prediction scales on all incident dementia. (D) Calibration plots of the UKB-DRP on AD at different incident times. (E) AUC plots of the UKB-DRP on AD at different incident times. (F) AUC plots of the UKB-DRP and existing prediction scales on all incident AD.
Abbreviations: AUC = Area under the ROC Curve, AD = Alzheimer's Disease, w/o = without, ApoE e4= Apolipoprotein E (ApoE) e4, CAIDE = Cardiovascular Risk Factors, Aging, and Incidence of Dementia Risk Score, DRS = Dementia Risk Score, ANUADRI = Australian National University Alzheimer's Disease Risk Index, UKB-DRP = UK Biobank Dementia Risk Prediction model. /EClinicalMedicine

