- Home
- China
- World
- Europe
- Politics
- Business
- Opinions
- Tech & Sci
- Culture
- Sports
- Travel
- Nature
- Picture
- Video
- Live
- TV
- Specials

Share

Copied
Editor's Note: Jimmy Zhu is a chief strategist at Singapore-based Fullerton Research. The article reflects the author's opinion, and not necessarily the views of CGTN.
There are many factors including companies' earnings, economic data, central bank policies, capital flows, etc., which can drive a stock's value when uncertainties rise. However, past experience shows that dollar's direction is one of the most straightforward indicators to gauge the upcoming moves in the global stocks market.
The relationship between the U.S. dollar and global stocks has been argued among market participants for decades. However, these two have moved in an opposite directions during periods of financial crisis or a slowdown in growth cycle. Such a relationship suggests that the recent negative sentiment in global stocks are unlikely to recover until the dollar starts to weaken.
Demands on cash tend to be high when there's lots of uncertainty. Many investors have to sell the stocks they are holding, as they worry the value of stocks will further drop. As a result, such activities are equal to "buying the dollar" when they dump the stocks. On the other hand, frequency of the stimulus packages announced during a crisis are always higher than normal, and these measures encouraged investors to buy stocks (sell the dollar) again.
Compared to normal, trading volumes are also extremely high in times of uncertainty. Thus, changes in the demand of the dollar becomes a reliable indicator in reflecting the market's sentiment from 2008 to 2012. The impact of the global financial crisis lasted for several years, causing the U.S. sovereign ratings to downgrade and euro zone debts crisis. The chart below shows that the dollar index has peaked by three times – November 2008, March 2009 and June 2010 – MSCI world index all rebounded immediately after that.
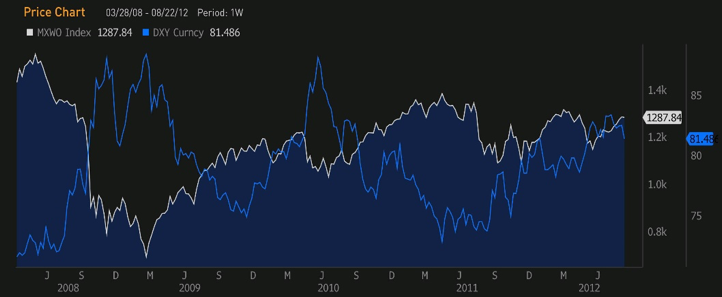
MSCI world index (white) vs. Dollar Index (blue). Source: Bloomberg
"Zero interest rate" policy is another reason that investors look for cash during a crisis. Sovereign bonds are usually considered as safe-haven assets. However, it's much less attractive when the interest rates are close to zero, because owning such securities would be no difference than holding cash. When the policy rate is already near zero, its downside room would be very limited.
Moves in the U.S. sovereign bonds yield usually follows the Fed's policy rate. The prices of bonds, which always move inversely to their yield, would have limited upside as well. The chart below shows that the U.S. 10-year government bond yield surged almost 100 bps from March 9 to March 19, rises in bond yield indicators that investors are selling these securities for cash.
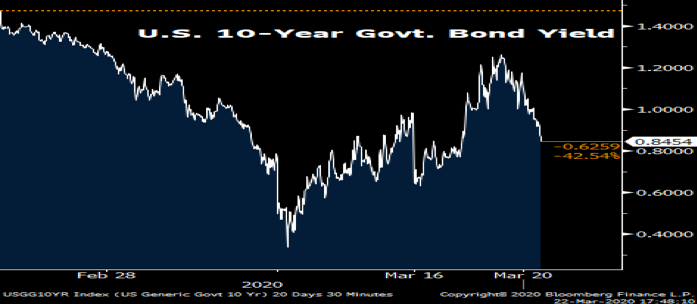
Source: Bloomberg
Still, the U.S. bonds yield might move into negative territory if coronavirus continues to spread, it could have a catastrophic impact on the U.S. economy. Such moves would force the Fed to adopt the "negative policy rates", otherwise the U.S. yield curve would invert again. A graph below shows that the U.S. Treasury curve was inverted a month ago, and then the curve steepened after the Fed adopted the emergency rate cuts twice in the past month.
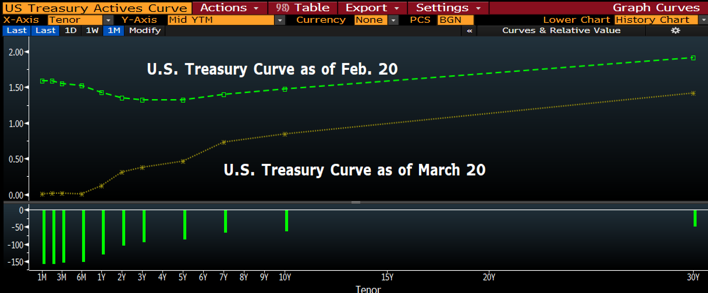
Source: Bloomberg
Bad liquidity is another key reason behind the rising dollar
Liquidity shortage is another concern for stock prices during a crisis. A tighter liquidity means a shortage of dollars in the financial system, which tends to lift the value of currency. But it's a bad indicator for the stock market. Fundamentally, a strong stock market needs three elements: economic growth, inflows and liquidities. At this moment, none of these elements are there.
The Fed has aggressively injected cash into the U.S. financial system, but data shows that the current liquidity condition is still very tight. The FRA (Forward Rate Agreement) – OIS (Overnight Index Swap rate) spread suddenly widened towards 90 bps in the middle of March, from 12 bps a month ago. The spread offers investors offer some clues that how expensive or cheap it will be for banks to borrow in the near futures, widening spread shows the interbank borrowing cost becomes more expensive as less banks are willing to lend.
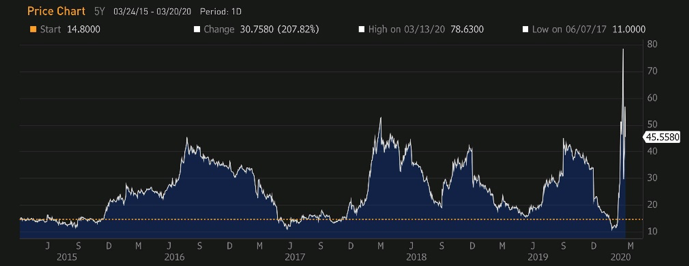
FRA – OIS spread. Source: Bloomberg
The FRA-OIS spread also shows how the market is positioning credit conditions. Once the economic outlook suddenly turns to be more pessimistic, commercial banks are less willing to lend to the public even when they receive the cash from the central bank. However, loan demands from companies and households are high in the economic downturn cycle, as they need more credit to pay back the debts. When loans demands are increasingly higher than the supplies, rates market will face the risk of "liquidity crunch", and potentially causing some of the high-leverage companies to default.