- Home
- China
- World
- Asia-Pacific
- Americas
- Europe
- Middle-East and Africa
- Politics
- Business
- Opinions
- Tech & Sci
- Culture
- Sports
- Travel
- Nature
- Picture
- Video
- Live
- TV
- Specials
- Learn Chinese

Share

Copied
In March, two sandstorms turned the skies in Beijing yellow and pushed the Air Quality Index (AQI) to 500, leaving the inhabitants of the Chinese capital gasping for fresh air under a canopy of dust. Venturing out of one's abode, one could feel the little particles of sand getting stuck between the fingers. The scene looked straight out of a doomsday movie.

But does that mean Beijing's overall air quality has fallen? Let's see what the statistics show.
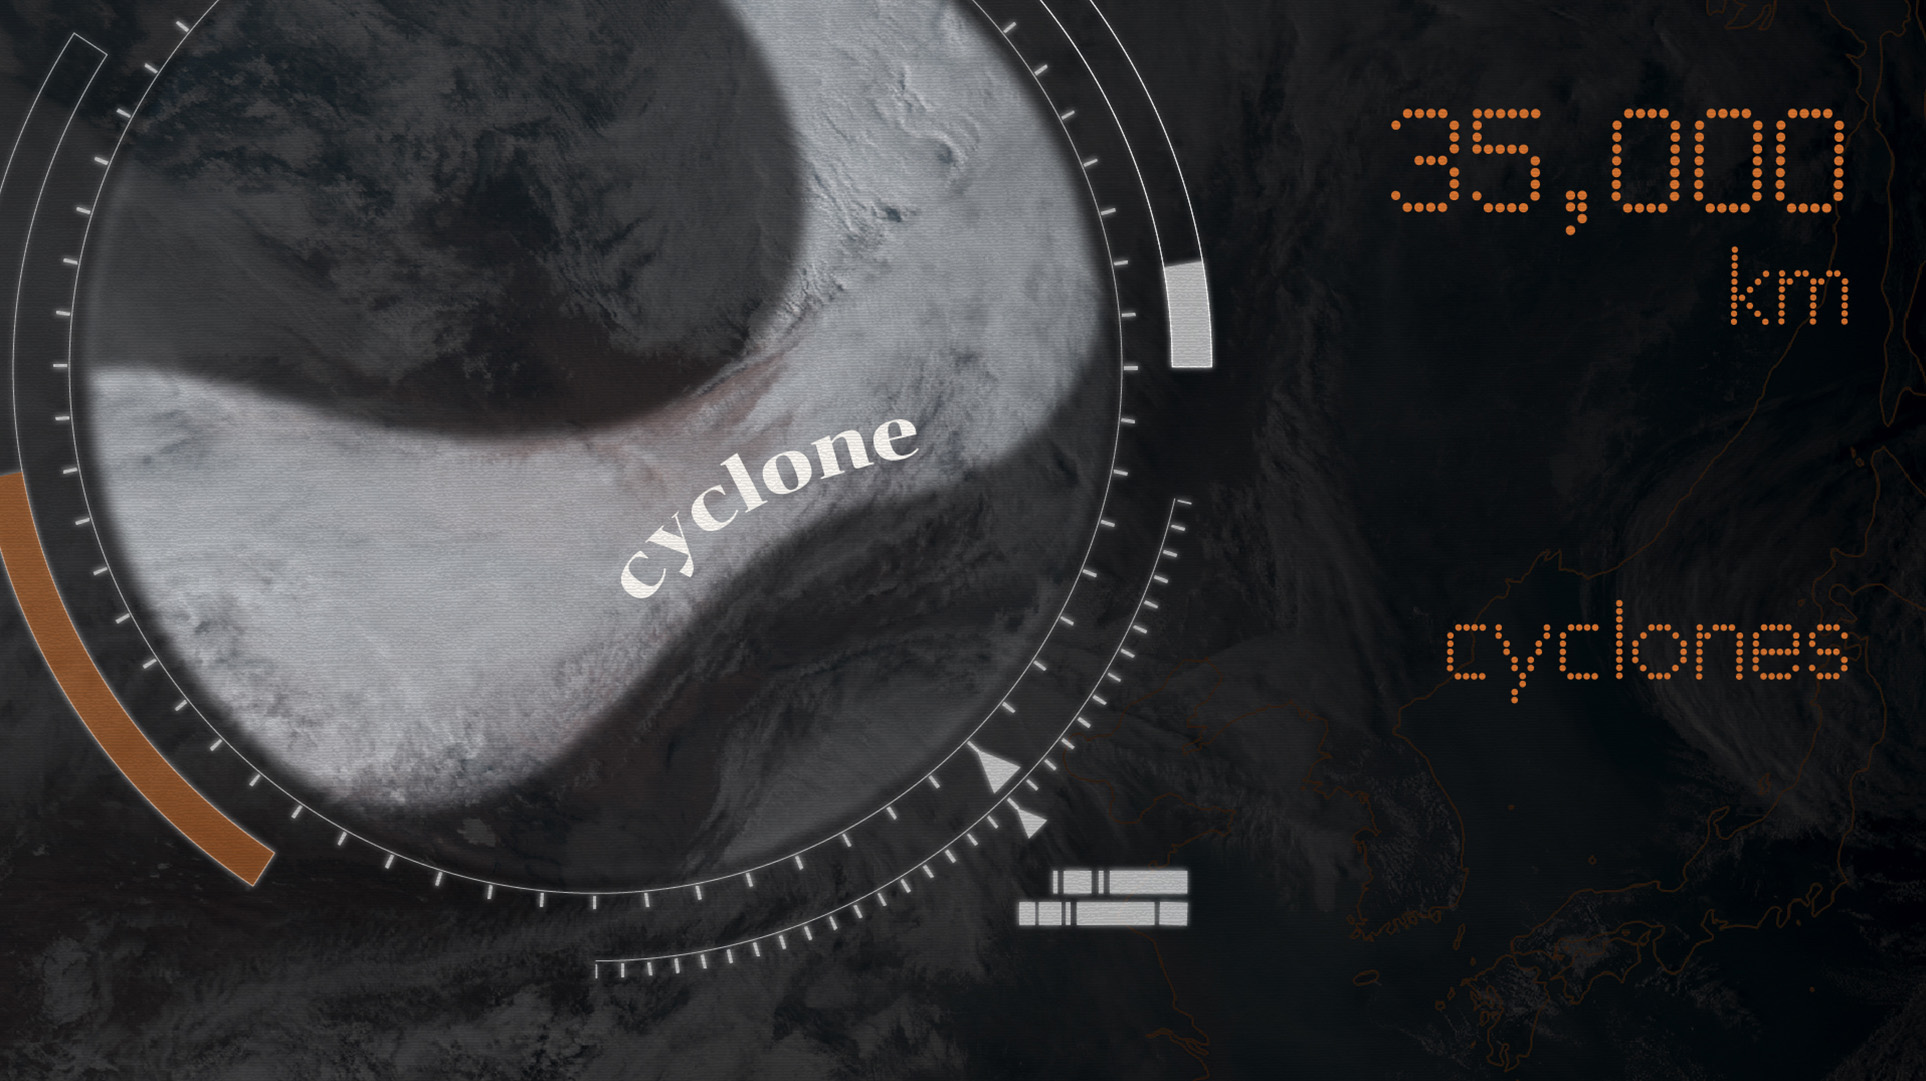
Observing the weather conditions from over 35,000 kilometers above the ground, one can see that the cyclones and sandstorms were formed in Mongolia. This clip records how the sandstorm was pushed by the cyclone all the way to north China during March 14 and 15.
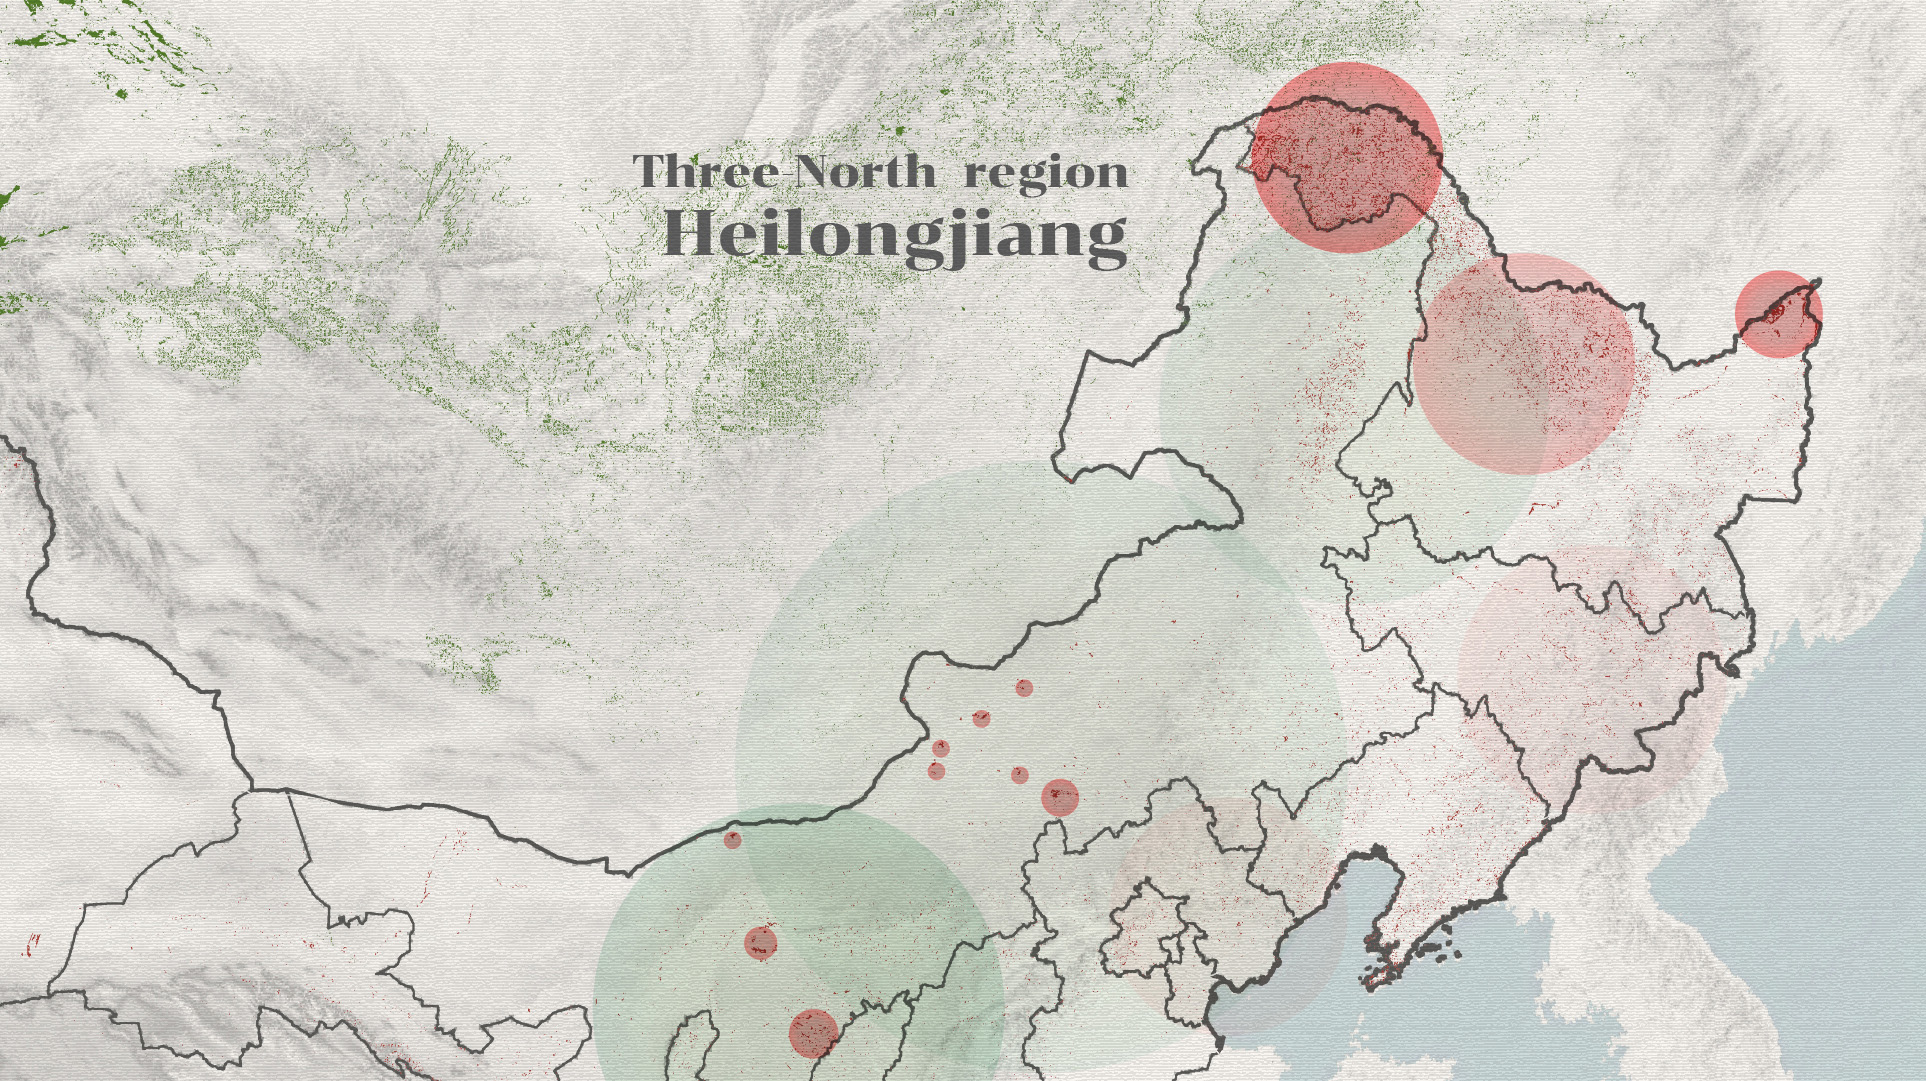
One may wonder if a decline in vegetation caused China's worst sandstorm in a decade. Have a look at this vegetation map. It shows the change in green barriers from 2000 to 2020. Red represents a decrease in forests and grasslands, while green indicates an overall increase. Here green obviously overpowers red.
Zooming in on the Three-North region, from Heilongjiang to Xinjiang, one can see that green patches are accompanied by scattered red areas. It's evident that the green barriers have increased in size, but the cyclone was too powerful for the trees to hold back the storm.
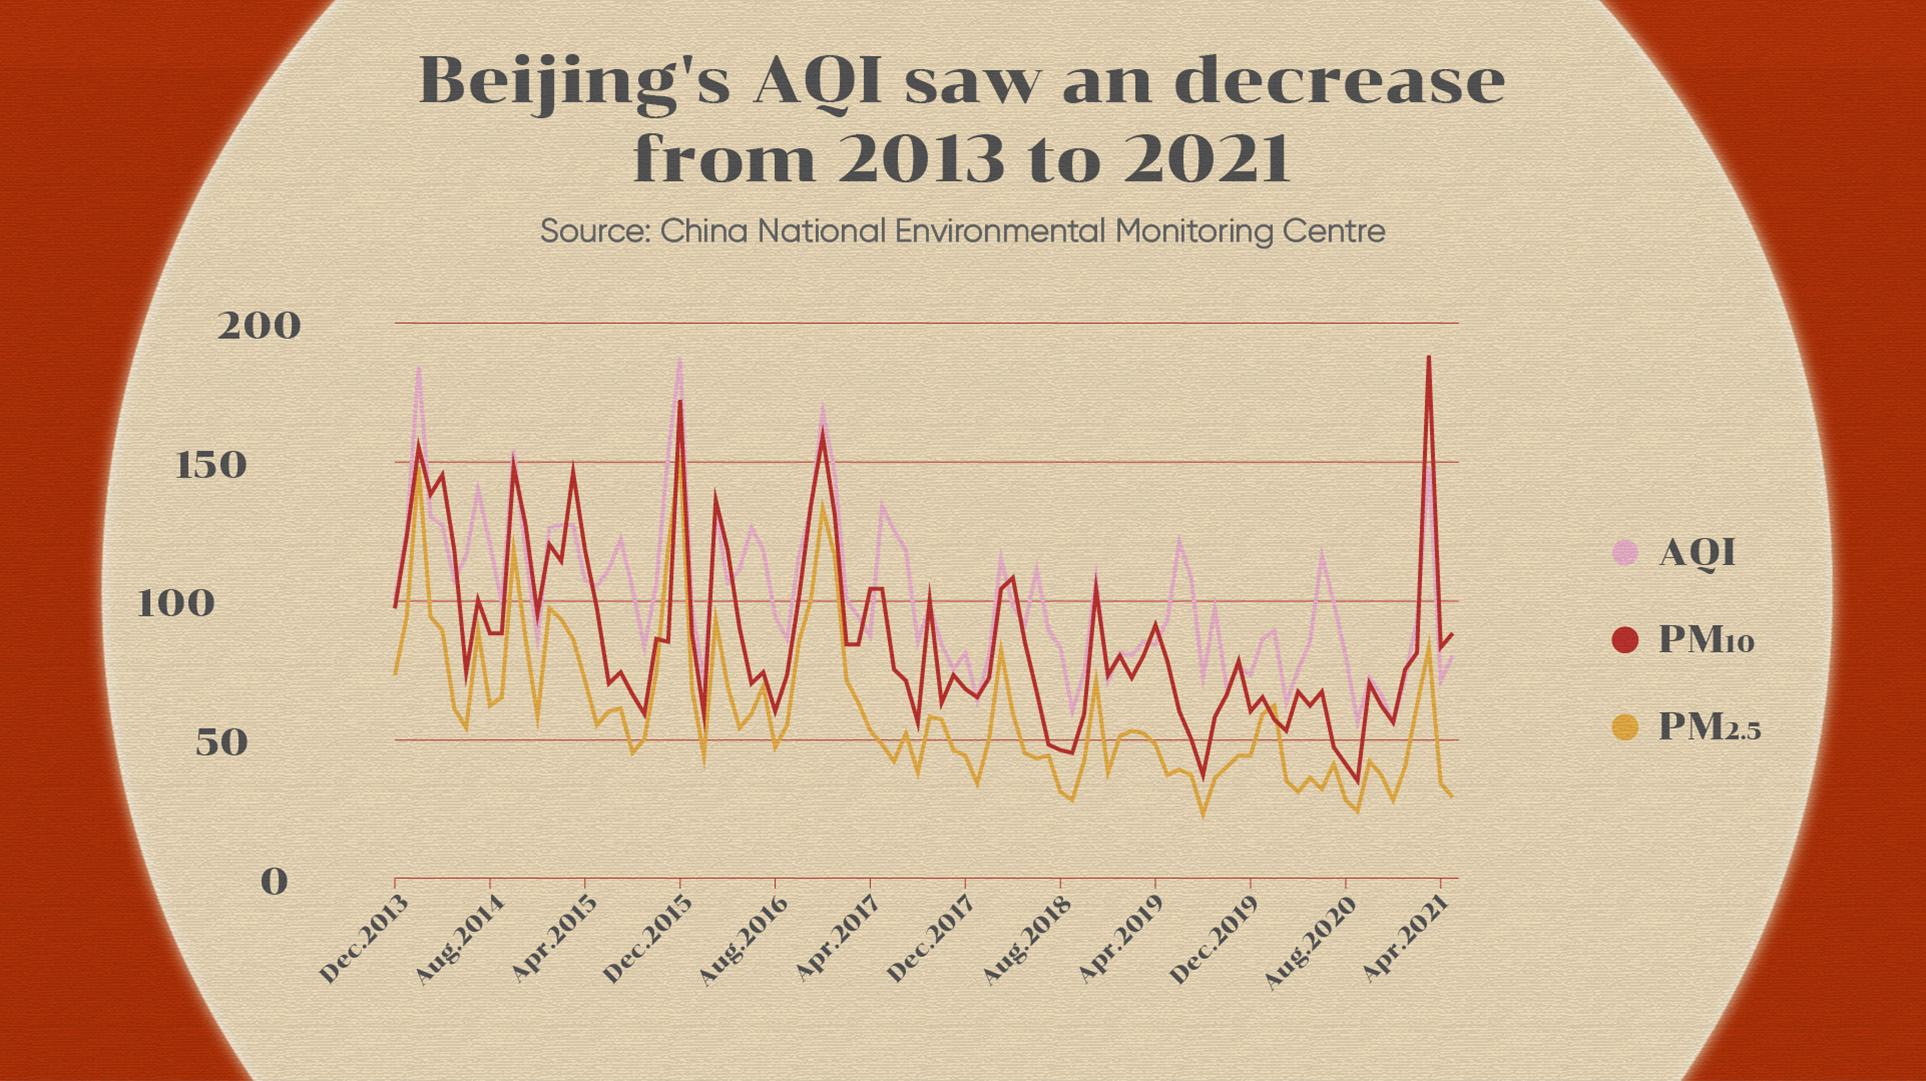
The main component of the sandstorms was PM10, which represents relatively large polluted particles. It includes dust from construction sites, landfills and agriculture, along with wildfires, waste burning and other industrial sources. But this pollutant and the smaller, more harmful PM2.5 have been decreasing.
The steady decline of the AQI demonstrates improvement in Beijing's air quality. And the recent hike in PM10 caused by the sandstorms was an isolated event in the past five years. It did not offset the progress Beijing has made.
But what about the rest of China? Have other areas also witnessed the dawn of victory in the battle against air pollution?
Before we dive into the data, it is important to understand that China uses a complex set of six indicators – PM2.5, PM10, SO2, NO2, O3 and CO – to measure AQI, which has been improving for a decade now.
The dots on the map represent 74 pilot cities in China monitored by the Ambient Air Quality Standards of 2012. From March 2015 to March 2017, nine out of 27 orange and red dots turned yellow, indicating a fall in PM2.5 levels nationwide.
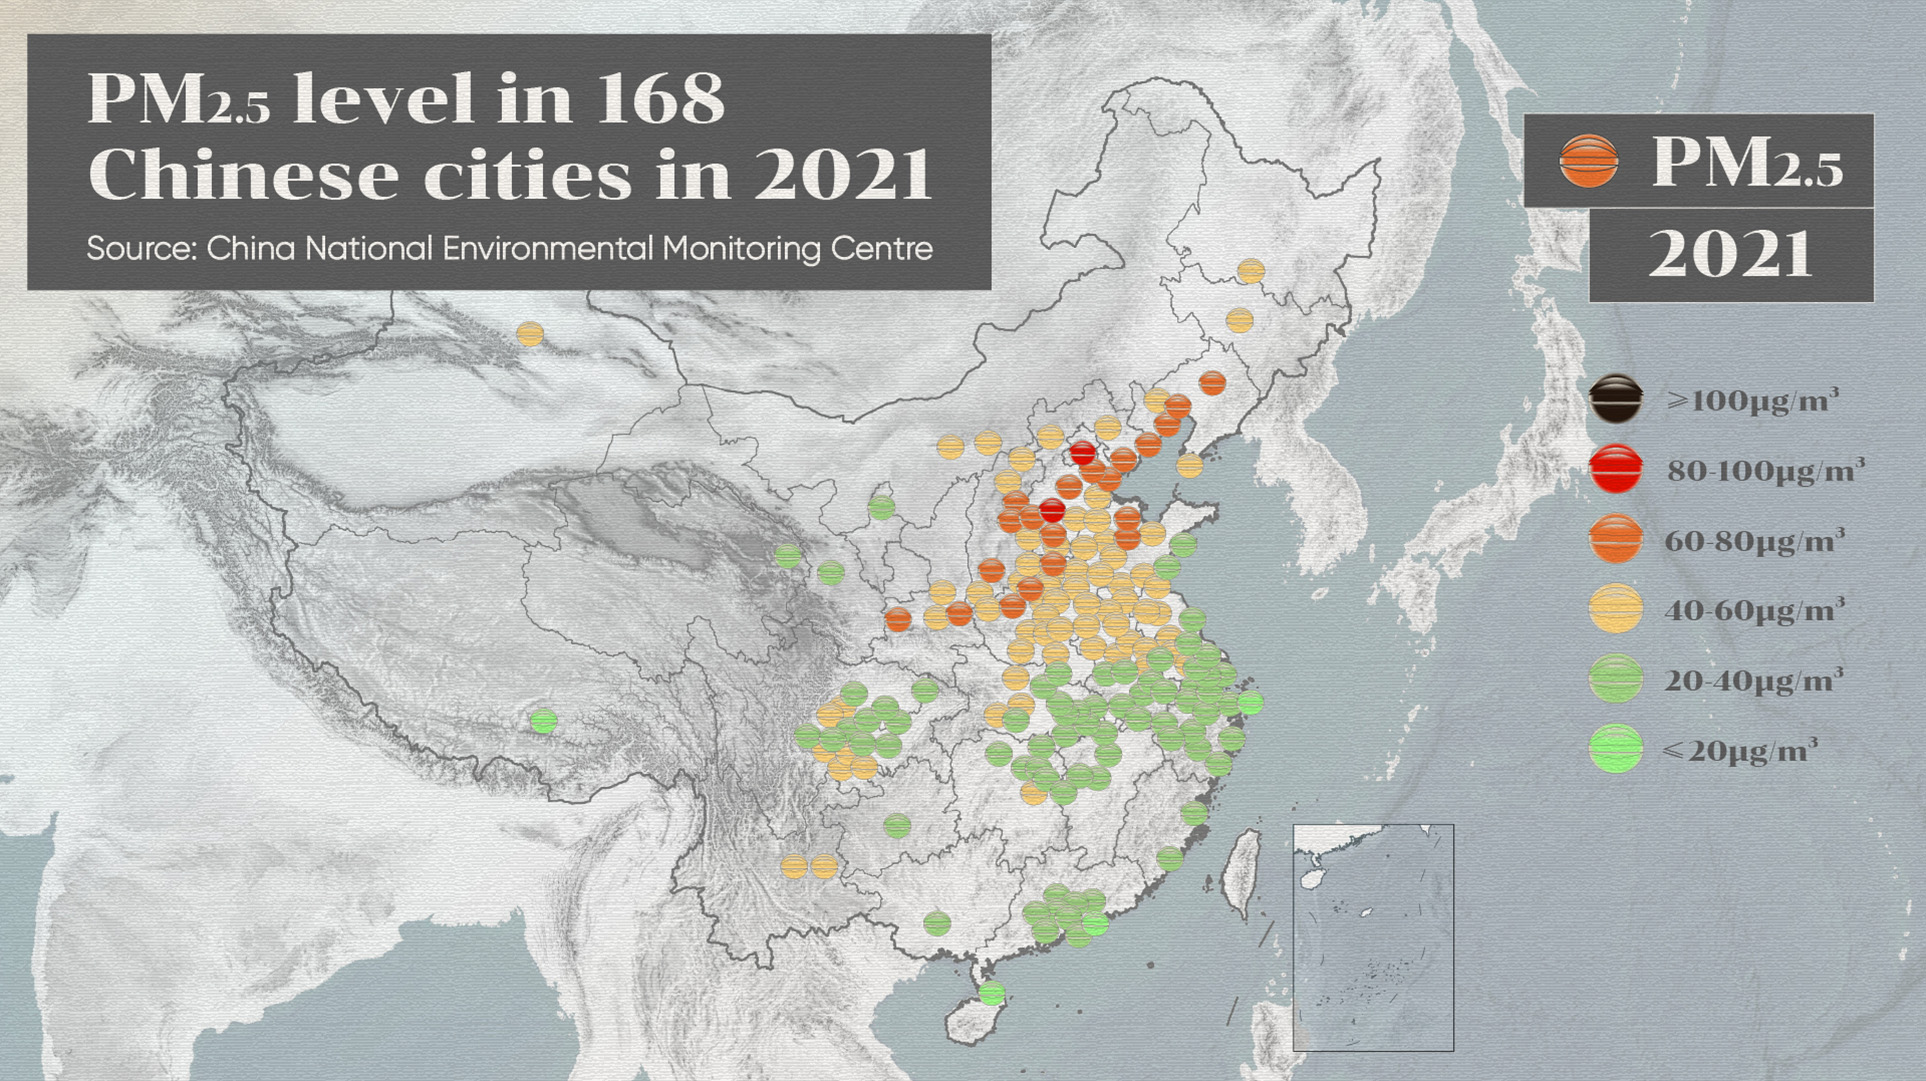
Now let's look at the larger mixed picture from recent years. The map here shows PM2.5 concentration across 168 cities in China from 2019 to 2021. While south China turned visibly green over the three years, northern and northwestern provinces of Shanxi and Shaanxi as well as the Beijing-Tianjin-Hebei region painted a more orange picture.
Moreover, NO2 and SO2 both declined from 2015 to 2021, but SO2 reduction was the most significant.
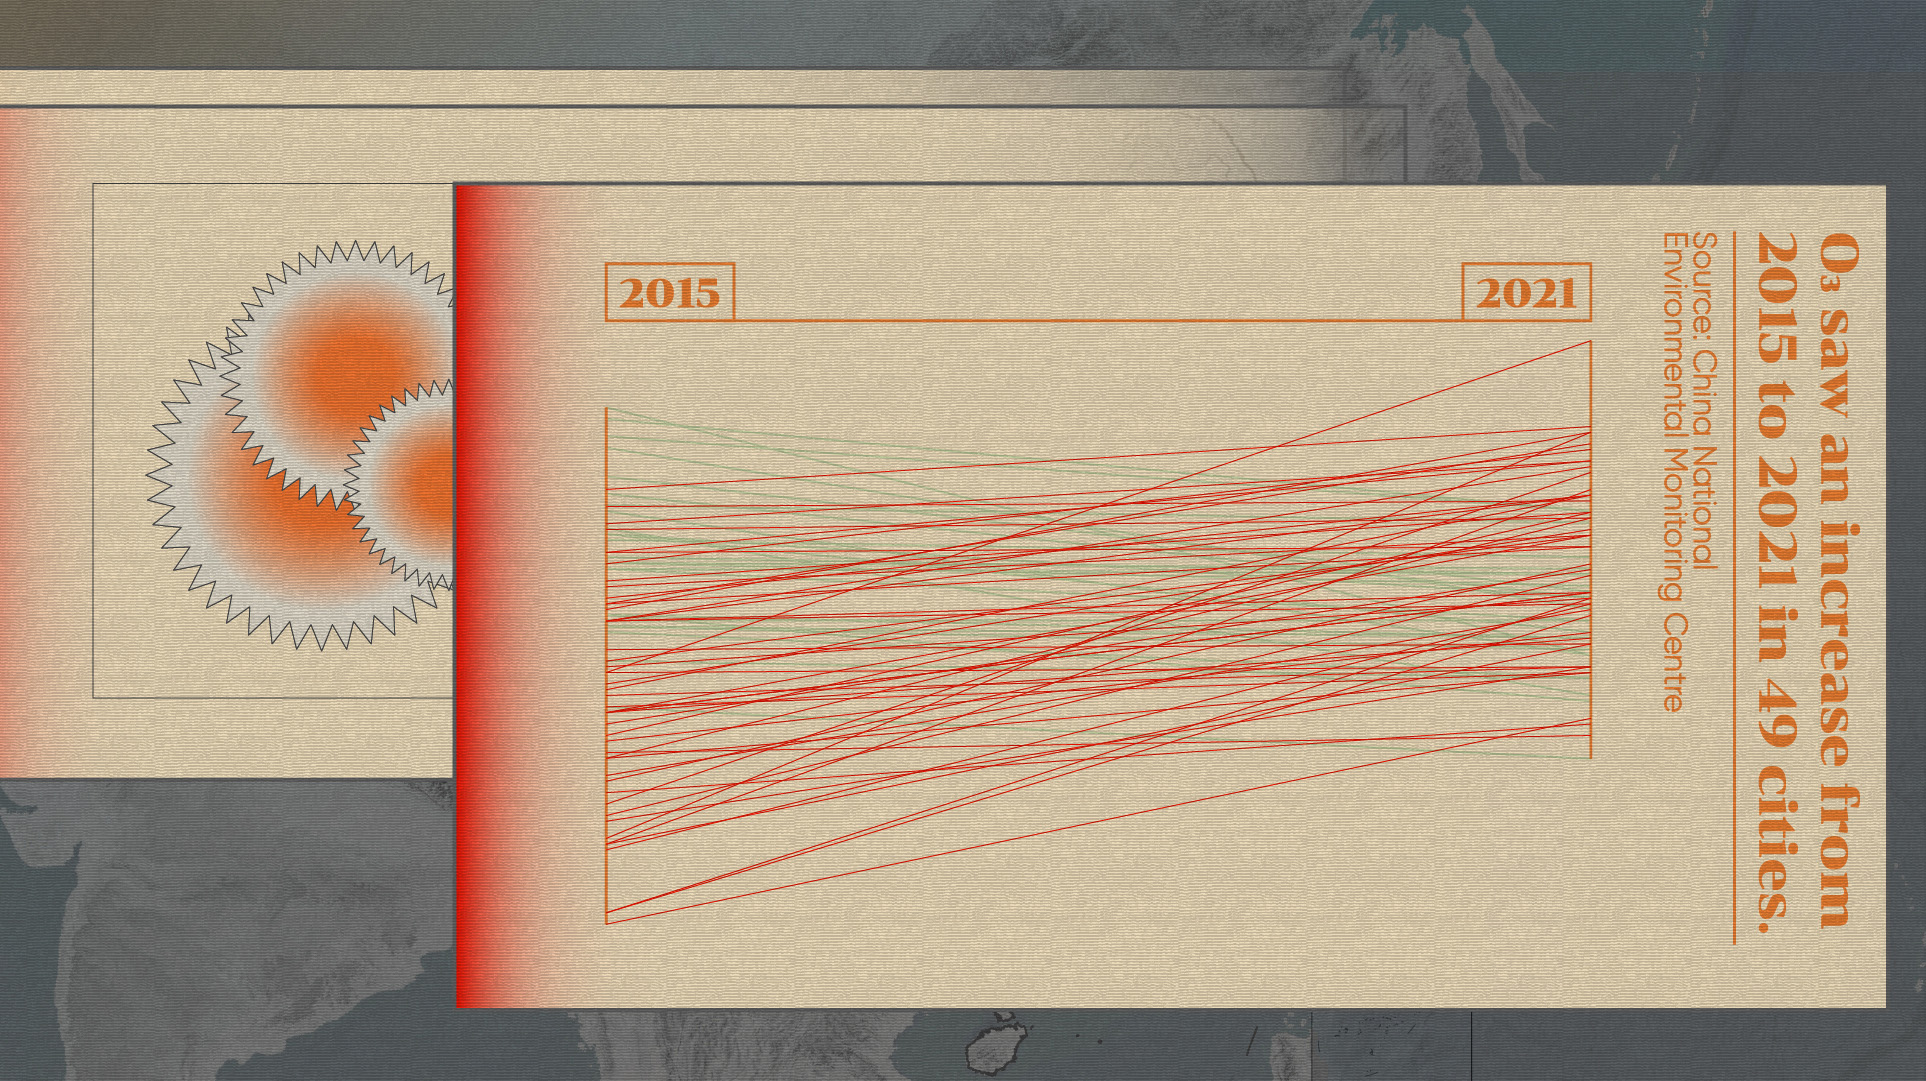
Amidst this overall positive trend, O3's performance is alarming. From 2015 to 2021, as many as 49 of 74 cities reported rises in O3. The increase is a good reminder that gaps still exist in China's fight against air pollution.
Although the sandstorms this year do not overshadow the achievements China has made in improving its air quality, more needs to be done to maintain and expand the green zones, our source of fresh air and future hope.
(If you want to contribute and have specific expertise, please contact us at opinions@cgtn.com.)