Business
16:10, 17-Oct-2017
Inequality gap closing in China as rural income rises
CGTN

Over the past decade China’s growth model has yielded steady progress in economic growth and development. While most observers agree the pace of transformation in China has been extraordinary, some remain concerned about the increasing income inequality.
The Gini coefficient is the most commonly used measure of inequality. Inequality on the Gini scale is measured between zero, where everybody is equal, and one, where all the country's income is earned by a single person. The United Nations considers a Gini coefficient higher than 0.4 a sign of severe income inequality.
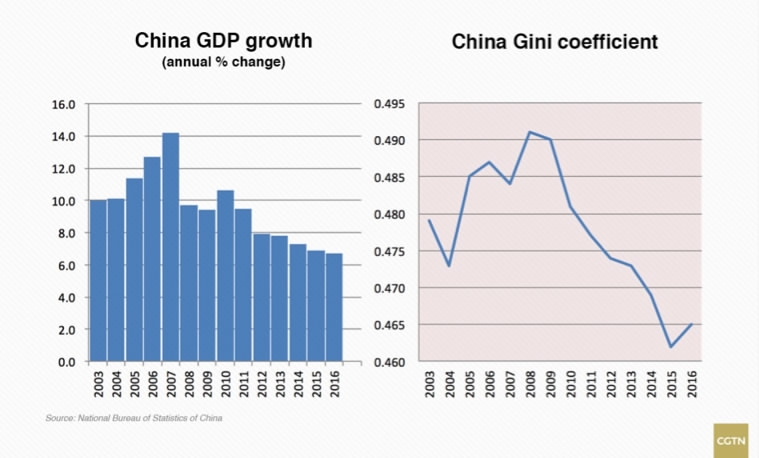
China’s index stood at 0.462 in 2016, according to the National Bureau of Statistics (NBS), while in the US it was 0.481. On a city level, Hong Kong recorded an all-time high of 0.539 last year, only second to New York’s 0.551.
Although high, China’s Gini coefficient has presented a generally declining trend, exemplifying a theory laid out in 1955 by Nobel Prize laureate in economics Simon Kuznets.

Simon Kuznets’ dream curve
The Kuznets curve is a hypothetical inverted U-shaped curve that graphs economic inequality against income per capita over the course of economic development.
Kuznets argued that as industrialization progresses, the center of the economy shifts from rural areas to the cities with rural laborers, such as farmers, migrating for better-paying jobs. This migration results in a large rural-urban income gap and rural populations decrease as urban populations increase.
However, that economic inequality is expected to decrease when average income reaches a certain level and the processes associated with industrialization, such as the development of a welfare state, take hold.
It is at this point in economic development that society is meant to benefit from a “trickle-down” effect and an increase in per capita income that effectively decreases economic inequality.
After dropping for seven years in a row, China’s most recent Gini index edged up from 0.462 in 2015. NBS Chief Ning Jizhe attributed the increase to the slow growth in pension income for poor urban families and the negative effect of falling grain prices on farmers’ income.
Yet the index is noticeably on the downward trend, and the shift has not occurred entirely spontaneously. It stems largely from redistributive policies.
China’s redistributive endeavors and achievements
The 18th National Congress of the Communist Party of China (CPC) in 2012 proposed to increase people's income and boost their "sense of gain." Sweeping measures have been implemented to make sure the country's first centenary goal of building a "moderately prosperous society in all respects" will be realized by 2020.
China has expanded basic health insurance and welfare, raised standards in pensions and minimum wages, made the first nine years of school free and abolished its 2,600-year-old agricultural tax.
The number of people living below the poverty line in China has been reduced by an average of 13 million each year since 2012.
The per capita disposable income of the country was 23,821 yuan (3,617 US dollars) in 2016, an increase of 62.6 percent from 2010, when Beijing set a goal of doubling that year’s income levels by 2020.
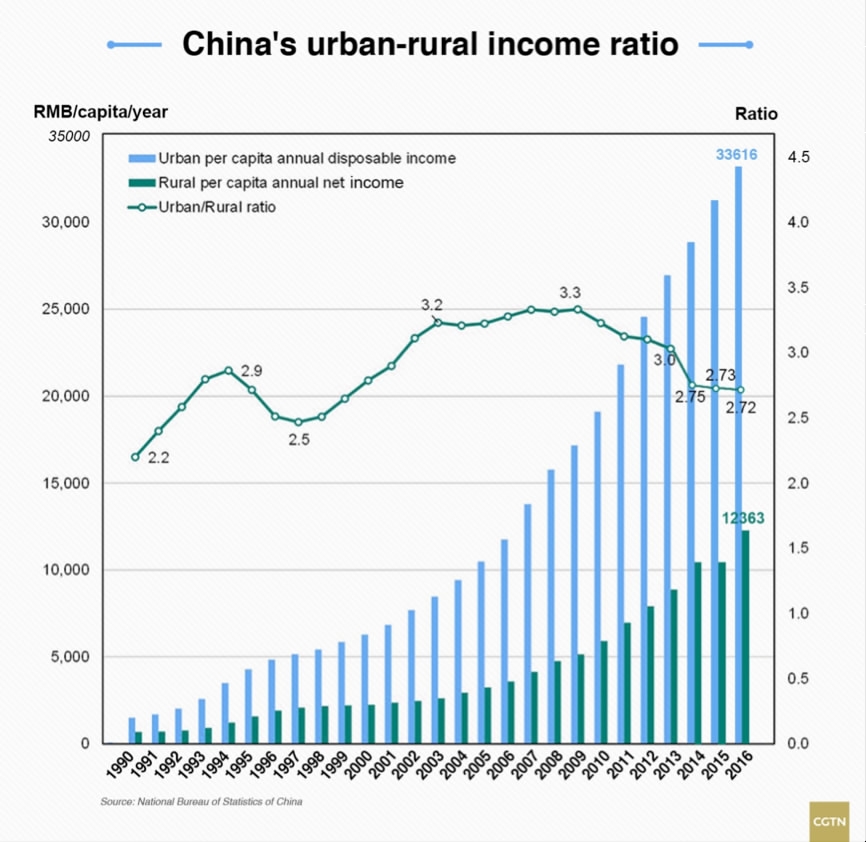
The income gap between urban and rural residents is narrowing. In 2009 the average urban income was 3.3 times higher than the average rural income. The gap has since narrowed to 2.72 times, following seven consecutive years in which rural incomes have grown at a quicker pace.

The disparity between the countryside and urban centers might have contributed to rising inequality, but it has also given way to policies that contributed to the decline in inequality.
The Engel's coefficient, the proportion of food expenditure in total spending, fell for the fourth consecutive year to 30.1 percent in 2016 from 33.0 percent in 2012. The index is seen as an indicator of a nation’s standard of living with the figure falling as a country’s economic growth makes its people wealthier and rising when they get poorer.
Meanwhile, the annual per capita consumption in the country was 17,111 yuan (2,601 US dollars) in 2016, up 33.1 percent from 2012. The average per capita consumption in cultural, educational and entertainment activities registered an annual increase of 9.1 percent between 2012 and 2016.
All the major indicators suggest that income inequality in the country is narrowing, but it remains to be seen when its Gini coefficient will drop below 0.4.

SITEMAP
Copyright © 2018 CGTN. Beijing ICP prepared NO.16065310-3
Copyright © 2018 CGTN. Beijing ICP prepared NO.16065310-3