
Analysis
12:49, 11-Jan-2019
Opinion: Inflation fears, not trade war to chart global investor portfolios
Updated
12:24, 14-Jan-2019
Share

Copied

Editor's Note: Jimmy Zhu is the chief strategist at Fullerton Markets. The article reflects the author's opinion, and not necessarily the views of CGTN.
Many Asian stocks closed lower on Thursday, although there were some fresh positive signs after the world's two biggest economies concluded three days of trade negations.
The lack of cheer in regional equities is a sign that markets are starting to weigh more on sentiment rather than progress on China-U.S. trade after the World Bank cut its global growth outlook this week.
Chinese inflation data released Thursday shows domestic demand, especially in the manufacturing sector, is turning softer. China's producer price index (PPI) only rose by 0.9 percent year-on-year in December, its slowest pace since September 2016.
PPI growth has been slowing consecutively for the past six months, and if such trends continue factory inflation could enter the contractionary territory.
Historic data shows deflationary pressure may remain throughout 2019
December's PPI-CPI spread is especially worth mentioning, after entering negative territory for the first time since 2016. The negative spread between the two stands at one percent in the latest reading, with the difference between the two usually reflecting conditions in domestic demand. PPI reflects the price of goods received by domestic producers, while CPI is a measure of prices paid by consumers.
Therefore, PPI can be taken as a leading indicator of ultimate price changes at the consumer level. A higher PPI usually points to a positive inflationary trend with overwhelming domestic demand, and a negative reading between PPI and CPI shows increasing deflationary pressure in China, where lower corporate profitability will also affect the rest of the world, given China is the largest commodity buyer.
If historical data is a guide, it suggests the deflationary environment will remain in place throughout this year.
There have been three cycles when PPI was lower than CPI in the past 15 years. The first one started in February 2007, when it took 13 months to return to positive territory. The second period kicked off in November 2008 and lasted for 14 months before returning to positive territory. The third one started at the end of 2011 and continued for almost five years.

Source: Bloomberg
Source: Bloomberg
Data shows PPI-CPI is a leading indicator for China's monetary policy
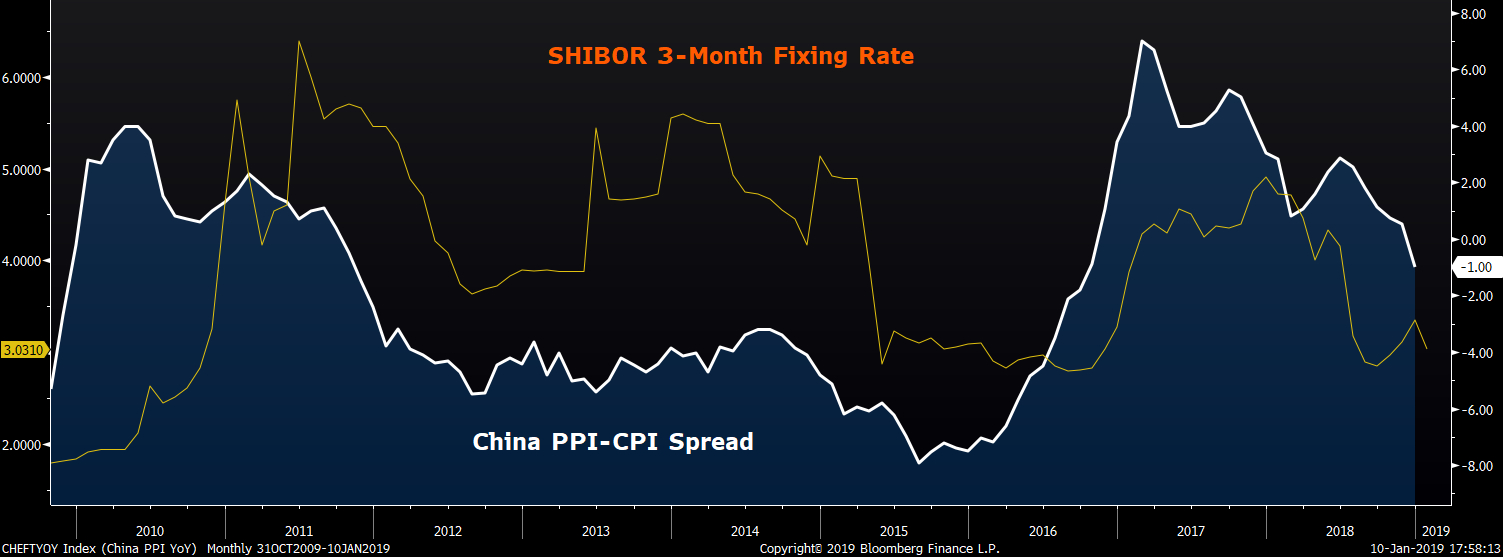
The chart below shows that the People's Bank of China's policymakers may pay significant attention to the PPI-CPI spread. The SHIBOR (Shanghai interbank offered rate) 3-month fixing rate, one of the major benchmark interbank borrowing rates, has closely followed the spread of PPI-CPI since 2010.
Source: Bloomberg
Source: Bloomberg
With the CPI-PPI spread a reliable indicator of future price trends, it can also be used to predict upcoming monetary policy, which is usually set according to the inflation outlook.
If the slowdown in Chinese factory inflation persists and slides into contraction territory, a more aggressive monetary and fiscal easing policy would be needed to offset the decline in companies' profitability and business confidence.
Tepid China factory inflation hints at further gains for high-graded bonds, and more stock market uncertainty
China is a major trading partner to most economies in the world, and it is also the world's biggest commodity buyer. Under such circumstances, changes in the nation's producer prices will easily influence inflation in the rest of the world, and accordingly affect the monetary policies of other countries.
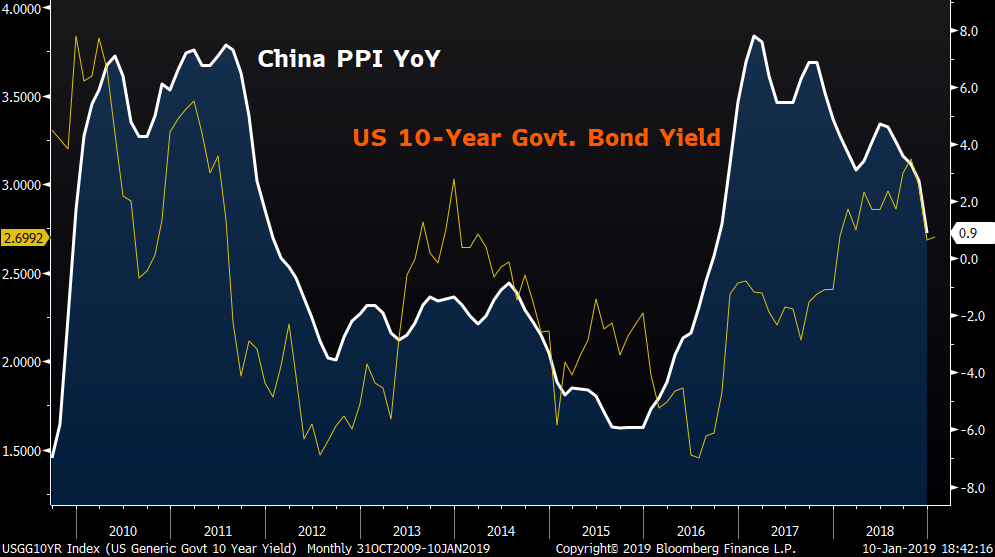
The U.S. 10-year sovereign bond yield can be used as a measure to reflect long-term growth and the inflation outlook in the world's largest economy and has had a 60 percent correlation with Chinese PPI in the last 10 years.
If such a relationship between the two indicators continues, a declining Chinese PPI means there is scope for U.S. bond yields to fall further, even with the ongoing unwinding of the Fed's balance sheet.
Source: Bloomberg
Source: Bloomberg
Any possible breakthrough in U.S.-China trade talks may not be sufficient for mainland stocks to extend their gains. Shanghai stocks has been moving closely with the yuan exchange rate, which is one of the most relevant proxies for gauging the effects of U.S.-China trade tensions. But so far this year, the Shanghai index is showing less correlation with the yuan.
Shanghai stocks are still underperforming when compared with regional peers, with the benchmark index rising 1.65 percent so far this year, compared to three percent for the MSCI Asia Pacific index.
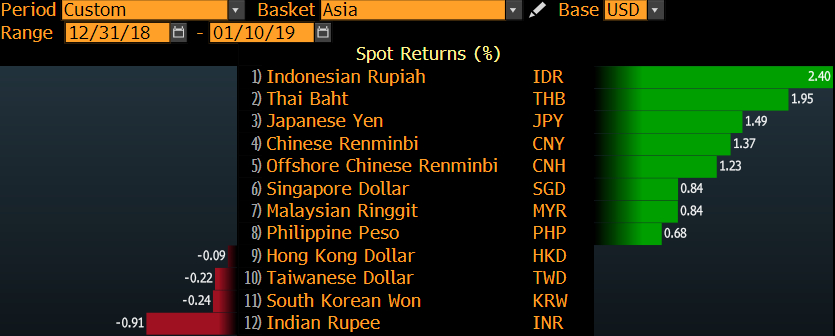
On the other hand, the Chinese yuan's performance since the start of the year ranks fourth among the 12 major Asian currencies. The failure of local stocks to catch up with gains in the Chinese yuan shows that trade disputes are weighing less on investor sentiment, with attention now potentially shifting towards growth outlook and how far the effects of monetary easing will travel into the private sector.
Source: Bloomberg
Source: Bloomberg