
Business
19:27, 24-Jul-2018
US labor market gets stronger as the trade deficit grows
Updated
18:29, 27-Jul-2018
Share

Copied

"When a country (US) is losing many billions of dollars on trade with virtually every country it does business with, trade wars are good, and easy to win." That was US President Donald Trump’s tweet in March. America’s more than 800 billion US dollar global trade deficit is often cited by the country's lawmakers, not just the President, as a source of domestic job losses.
The fear of losing American jobs to foreign countries plays a salient role in the politics of employment. It happens through each US election cycle. “Losing on trade” is a rallying cry of the current Washington administration and it has never been louder. The US trade deficit with China is one reason used by President Trump to justify tariffs on Chinese goods.
But to what degree is the US trade deficit really costing American jobs? Do the numbers support this argument?
Data from the United States itself points to a resounding no. Numbers from the US Bureau of Labor Statistics and US Census Bureau show there is little relationship between the US trade deficit and job losses, but that also for most of the time since America began running a trade-in-goods deficit, the opposite is actually true. The larger the US trade deficit grew, the lower the unemployment rate fell. Let that sink in for a moment.
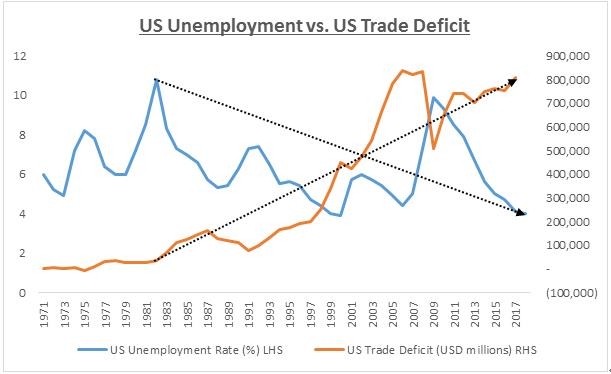
Fig.1 Source: US Bureau of Labor Statistics, US Census Bureau
Fig.1 Source: US Bureau of Labor Statistics, US Census Bureau
Figure 1 above shows the relationship between the US trade deficit and the unemployment rate since 1971. This is the earliest since the US began consistently running deficits with its major trading partners.
The recession of the early 1980s saw the United States stuck with its highest unemployment rate since the Great Depression, at 10.8 percent in 1982. From 1982 to just before the dot-com crash of 2001, the US trade deficit surged nearly 12-fold, while its unemployment rate precipitously fell.
America saw a strong negative correlation between its trade deficit and its unemployment rate, at -0.79 (Fig.1.a). A negative correlation simply means that as one variable increases, the other decreases. A reading close to -1 indicates a perfect negative correlation, 0 means no correlation, and +1 means perfect positive correlation. In this case, as the trade deficit increased, the unemployment rate decreased.
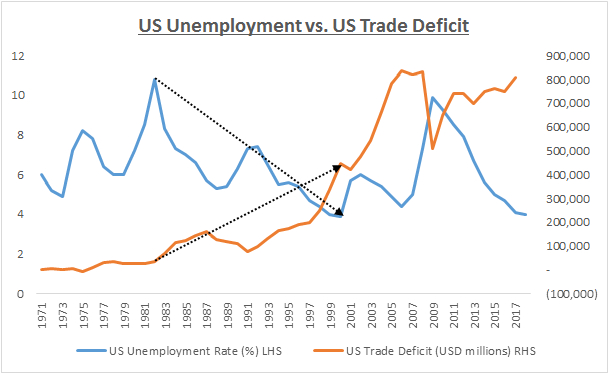
Fig.1.a, Source: US Bureau of Labor Statistics, US Census Bureau
Fig.1.a, Source: US Bureau of Labor Statistics, US Census Bureau
The strong negative correlation grew even stronger as the American economy recovered and bounced back in the post tech bubble years. There was talk of a “Great Moderation” where the volatility of business cycles became more manageable and muted. As business and consumer confidence grew, the spending power of American households nearly doubled the country’s trade deficit from 2001 to just before the eve of the global financial crisis.
If the trade deficit destroys American jobs, one would certainly expect the US unemployment rate to also swell during this period. But, the numbers once again show the exact opposite. With an almost perfect negative correlation from 2001 to 2006 of -0.93 (Fig.1.b), the evidence is even stronger that a rise in the US trade deficit actually coincides with a fall in the unemployment rate and a more robust American labor market.
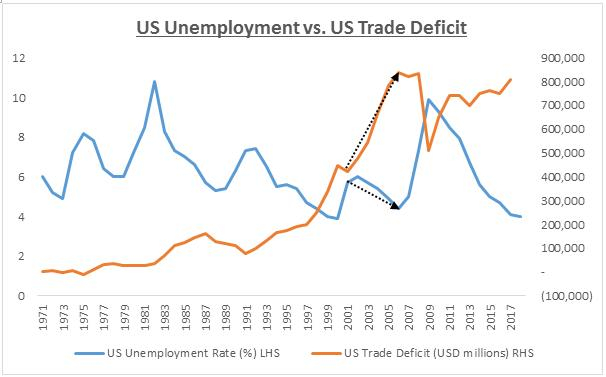
Fig.1.b, Source: US Bureau of Labor Statistics, US Census Bureau
Fig.1.b, Source: US Bureau of Labor Statistics, US Census Bureau
To no surprise, with the onset of the global financial crisis, US consumers severely pulled back. A plunge in spending meant less imports from abroad. The US trade deficit naturally shrunk. The inverse relationship between deficits-and-jobs rears its head once more, but now in the opposite direction. This time as the US unemployment rate soared from 4.4 percent in 2006 to 10 percent in 2009, the trade deficit cratered, freefalling by 40 percent in nominal terms (Fig.1.c). One sure way to shrink America’s trade deficit is for the country to fall into recession.
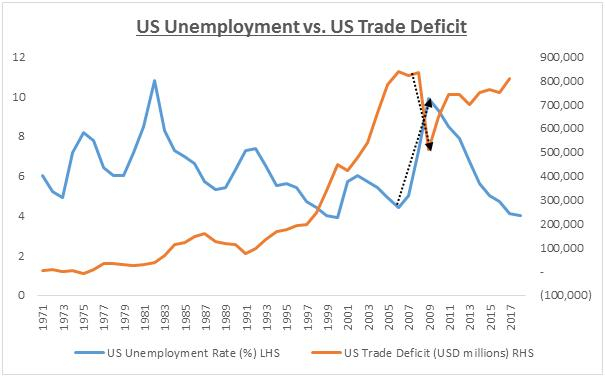
Fig.1.c, Source: US Bureau of Labor Statistics, US Census Bureau
Fig.1.c, Source: US Bureau of Labor Statistics, US Census Bureau
As the world began to recover after the depths of the financial crisis, it’s easy to see how the US unemployment rate steadily falls again as the trade deficit rises once more. By the end of 2017, the US trade-in-goods deficit stood at its fourth-largest on record, yet its unemployment rate came in at 4.1 percent, a 17-year low.
It’s a far cry from the claim that trade deficits wreak havoc on the US labor market. There is a misconception among many in the United States that trade deficits are inherently “bad.” This perspective is one dimensional.
Rather, America’s trade deficit is a mirror image of what propels its economy: consumption. When consumption is strong as when the economy is growing, the trade deficit rises.
When consumption is weak as when the economy goes into recession, the trade deficit falls. With consumption driving 70 percent of the US economy, a rising trade deficit is actually reflective of robust economic activity as US households have more to spend on goods from abroad.
If as President Trump claims, a burgeoning trade deficit means everyone else is winning in trade at the expense of America then the US economy should not be so sturdy. Instead, the US is the world’s largest economy by nominal GDP and since 1971 US output has expanded in lockstep with its rising trade deficit (correlation = 0.95, Fig.2). US industrial production, a gauge of real output for American manufacturing also rose in tandem with the trade deficit (Fig.3). It’s further proof that global trade does not hollow out US manufacturing, but rather shifts its production to other goods, which the US has a comparative advantage in making.
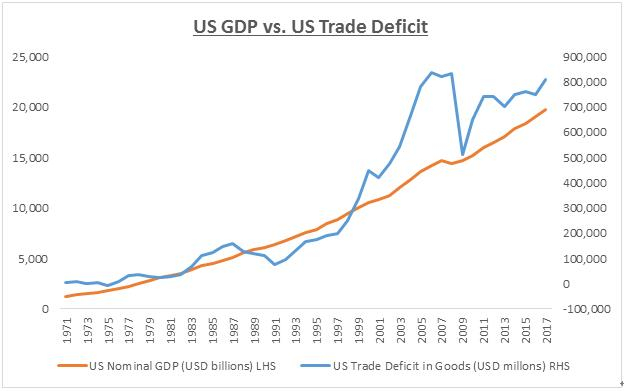
Fig.2, Source: St. Louis Federal Reserve, US Census Bureau
Fig.2, Source: St. Louis Federal Reserve, US Census Bureau
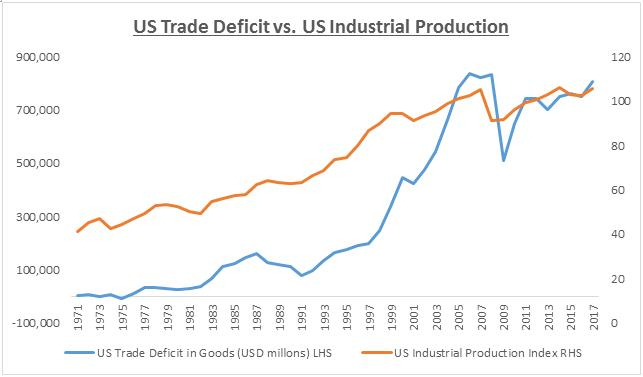
Fig.3, Source: St. Louis Federal Reserve, US Census Bureau
Fig.3, Source: St. Louis Federal Reserve, US Census Bureau
When Washington uses the trade deficit as a justification for tariffs on China and other major trading partners, the numbers simply don’t add up. It’s a mistaken assumption to begin with. The United States should take a bigger-picture and longer term view towards its trade and economic relationship with China. From 1997 to 2017, US exports to China grew at a compound annual growth rate that was almost four times faster than US exports to the European Union during the same period (earliest US trade data with EU begins in 1997).
There are countless forecasts predicting that China will eventually be home to the world’s largest middle income class and also the world’s largest consumer market. The economics of China’s population size and its rising spending power has already determined this outcome. It’s not only a huge opportunity for US firms, but for all global companies ready to prosper with China, together.