POLITICS

7 charts that explain immigration in the United States
2017-03-11 10:49:12 GMT+8

Editor
Gao Yun
Story by CGTN America
President Donald Trump has promised to crack down on illegal immigration, including speedier deportations of those with criminal backgrounds, and the construction of a wall along the southern US border with Mexico.
In February, US Immigration and Customs Enforcement (ICE) launched a series of targeted operations in Los Angeles, Chicago, Atlanta, San Antonio, and New York City. On March 8, the Department of Homeland Security (DHS) opened the bidding process for contractors to construct the border wall.
CGTN America created analyzed government data to create seven charts that help explain the status of immigration in the United States.
1. US population in 100 dots
Of the more than 324 million people residing in the United States, an estimated 11.4 million are unauthorized immigrants, according to a 2012 report by the Department of Homeland Security (DHS).
But what does that actually look like?
We looked at DHS and Census data from 2012-2014 to visualize the US population as 100 dots.
All the black dots below represent people born in the US - there’s 86 of them. The blue dots are the immigrants that came to the United States illegally. They make up 3.5 dots.
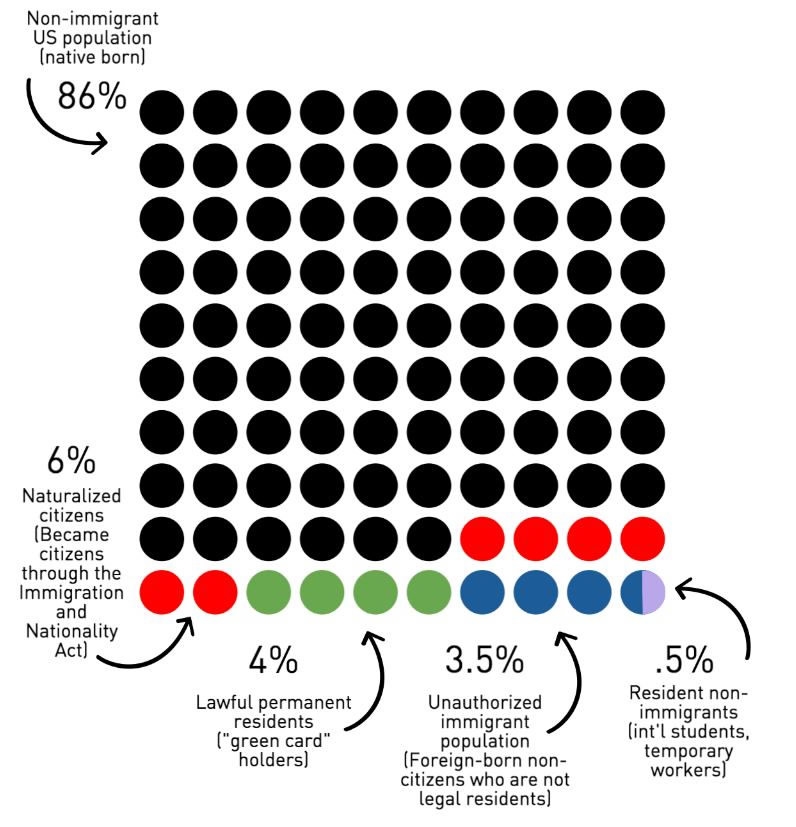
US population in 100 dots. /CGTN Photo
Naturalized US citizens, immigrants who became citizens by meeting standards in the Immigration and Nationality Act, make up six percent of the population or the six dots in red.
Lawful permanent residents such as “green card” holders make up the four green dots.
Resident nonimmigrants make up 0.5 percent of the US population, or half a dot. These are foreign nationals who were legally admitted into the US for specific, temporary purposes such as international students and temporary workers.
Not pictured: Refugees and asylum seekers who make up only 0.02 percent of the US population, according to DHS. After one year in the United States, refugees are required to apply for “green card” status, and asylum seekers are permitted to apply for their “green card.”
2. Most unauthorized immigrants to the US have lived in the country for more than a decade
Nearly 60 percent of immigrants living illegally in the United States have been there for 12 years or more, and nearly 87 percent have lived in the US since before 2005, a 2012 DHS report found.

Period of entry for unauthorized immigrants. /CGTN Photo
3. Illegal immigration from Mexico is falling
2015 data from DHS shows the number of non-citizens from Mexico apprehended is significantly down. According to the Migration Policy Institute, some analysts have attributed this to improved economic conditions in Mexico, less job demand in the United States, increased enforcement and increased use of “different enforcement tactics” at the US border.
Meanwhile illegal immigration from Honduras, Guatemala, and El Salvador has increased. Pew Research says this is due in part to “a surge in unaccompanied Central American child migrants crossing the border without their parents.”
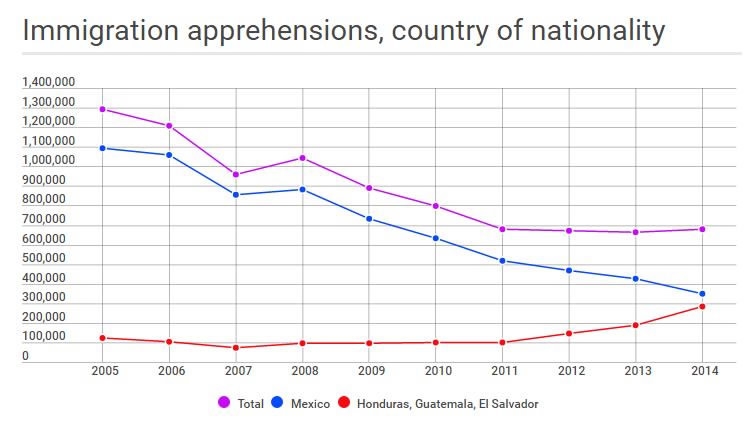
Immigration apprehensions, country of nationality. /CGTN Photo
4. Type of deportation matters
There are two DHS definitions to remember when thinking about deportations: Removals and Returns.
Removals: These are compulsory deportations based on an order of removal from a US immigration judge. When a non-citizen is removed, US ICE agents physically escort the unauthorized immigrant to a “point of departure” at the US border.
Returns: These are voluntary departures. This permits an unauthorized immigrant to leave the US without an immigration hearing ordering them to do so. At the discretion of the US government, an unauthorized immigrant can withdraw an application for admittance without being subject to a five-year ban on re-entry.
Both removals and returns are types of deportations. Here’s a look at both using DHS statistics.
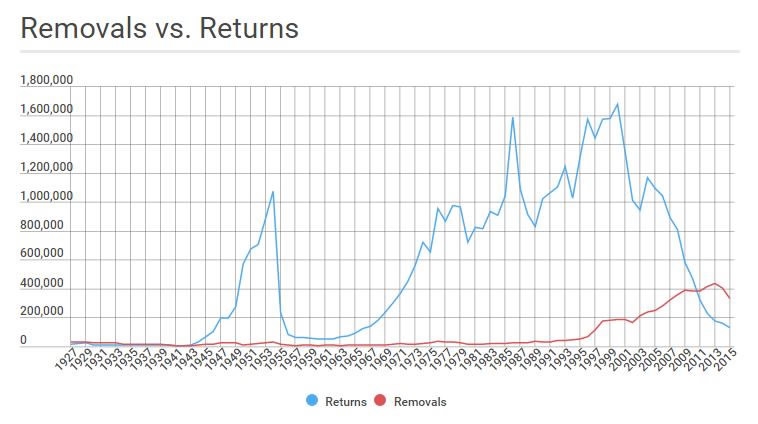
Removals vs. Returns from 1927 to 2015. /CGTN Photo
Former President Barack Obama had more removals under his presidency than prior presidents, leading many critics to dub him “Deporter-in-Chief."
However, he had far fewer returns that previous presidents.
The Migration Policy Institute says: “Noncitizen removals increased significantly, while apprehensions and overall deportations both remained far lower than the numbers seen under the Bush and Clinton administrations.”
George Mason University Professor Bryan Caplan, who is also a research fellow at the Libertarian Mercatus Center, estimated that since a removal has harsher penalties than a return, returns should count as 0.85 percent of one removal. Based on his index, former presidents Jimmy Carter, Ronald Reagan, Bush I, Clinton, Bush II all had more deportations than Obama.
“The real Deporter-in-Chief was none other than (Obama’s) fellow Democrat Bill Clinton. Adjusting for population, no one else even comes close,” Caplan writes.
5. Criminal and non-criminal deportations
President Trump has said that he will focus on removing immigrants who are not only in the United States illegally, but also constitute threats to public safety. DHS data shows that of all deportations between 2005-2014, 60 percent were for non-criminal reasons, and 40 percent for criminal reasons. Here’s the breakdown by country of origin for nations with 1,000 or more deportations between 2005-2014.
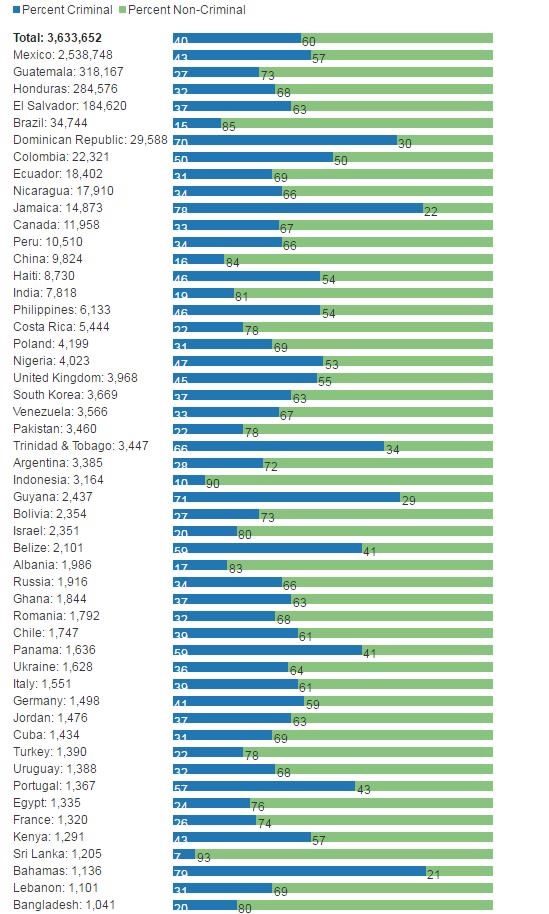
Deportations by country of origin, 2005-2014. /CGTN Photo
The DHS defines a criminal removal as the deportation, exclusion, or removal of someone who has been charged with a criminal conviction.
Chart only includes countries with more than 1,000 total deportations between 2005-2014. Order is from the most number of deportations to the least.
6. Remembering the past
Between 1880 and 1889, the majority of people who wanted to be US citizens came from Germany, the United Kingdom, Italy and Russia.
According to DHS data, more people obtained lawful permanent resident status in 1907 than in 2014. The year with the highest-ever number of people who got “green cards” was 1991.
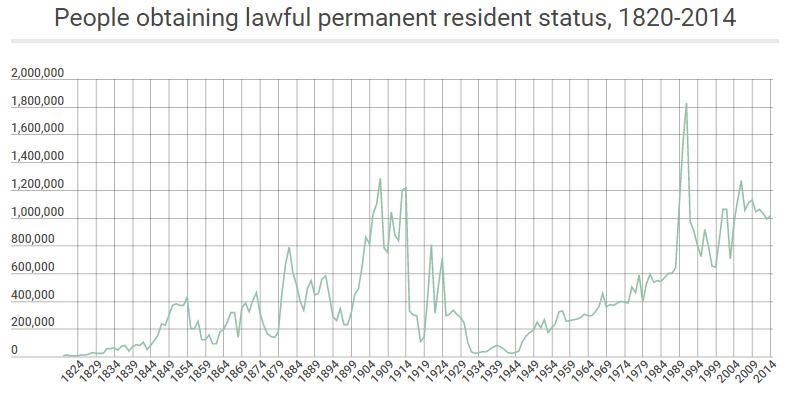
People obtaining lawful permanent resident status, 1820-2014. /CGTN Photo
7. Planes and boats vs. wheels or feet
According Reuters, an internal DHS report has estimated that Trump’s proposed wall could cost as much as 21.6 billion US dollars. This is more than half of the 2016 budget for the entire Department of Homeland Security.
But according to data from Robert Warren and Donald Kerwin of the Center for Migration Studies, visa overstays by air or by sea far exceed those who cross illegally on the southern border by foot or vehicle.
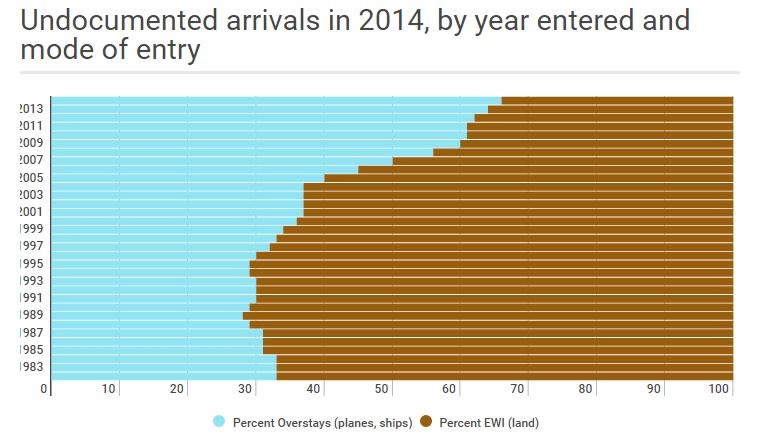
Undocumented arrivals in 2014. /CGTN Photo
Using DHS data, the Center for Migration Studies found that in 2014, 66 percent of the people in the US illegally did so through an overstay, and entered by plane or by boat. Only 34 percent came by land.
The DHS defines an overstay as someone who was lawfully admitted into the US by air or by sea for a period of time, but remained beyond this period.
Those who come in illegally overland at the border are categorized EWI or Entry without inspection.
Copyright © 2017
SHARE


- EXPLORE
- MORE
FOLLOW US