- Home
- China
- World
- Asia-Pacific
- Americas
- Europe
- Middle-East and Africa
- Politics
- Business
- Opinions
- Tech & Sci
- Culture
- Sports
- Travel
- Nature
- Picture
- Video
- Live
- TV
- Specials
- Learn Chinese

Share

Copied
It's classic New York City craziness – rainwater pouring into a station from every direction, rushing down the stairs and leaking from the ceiling.
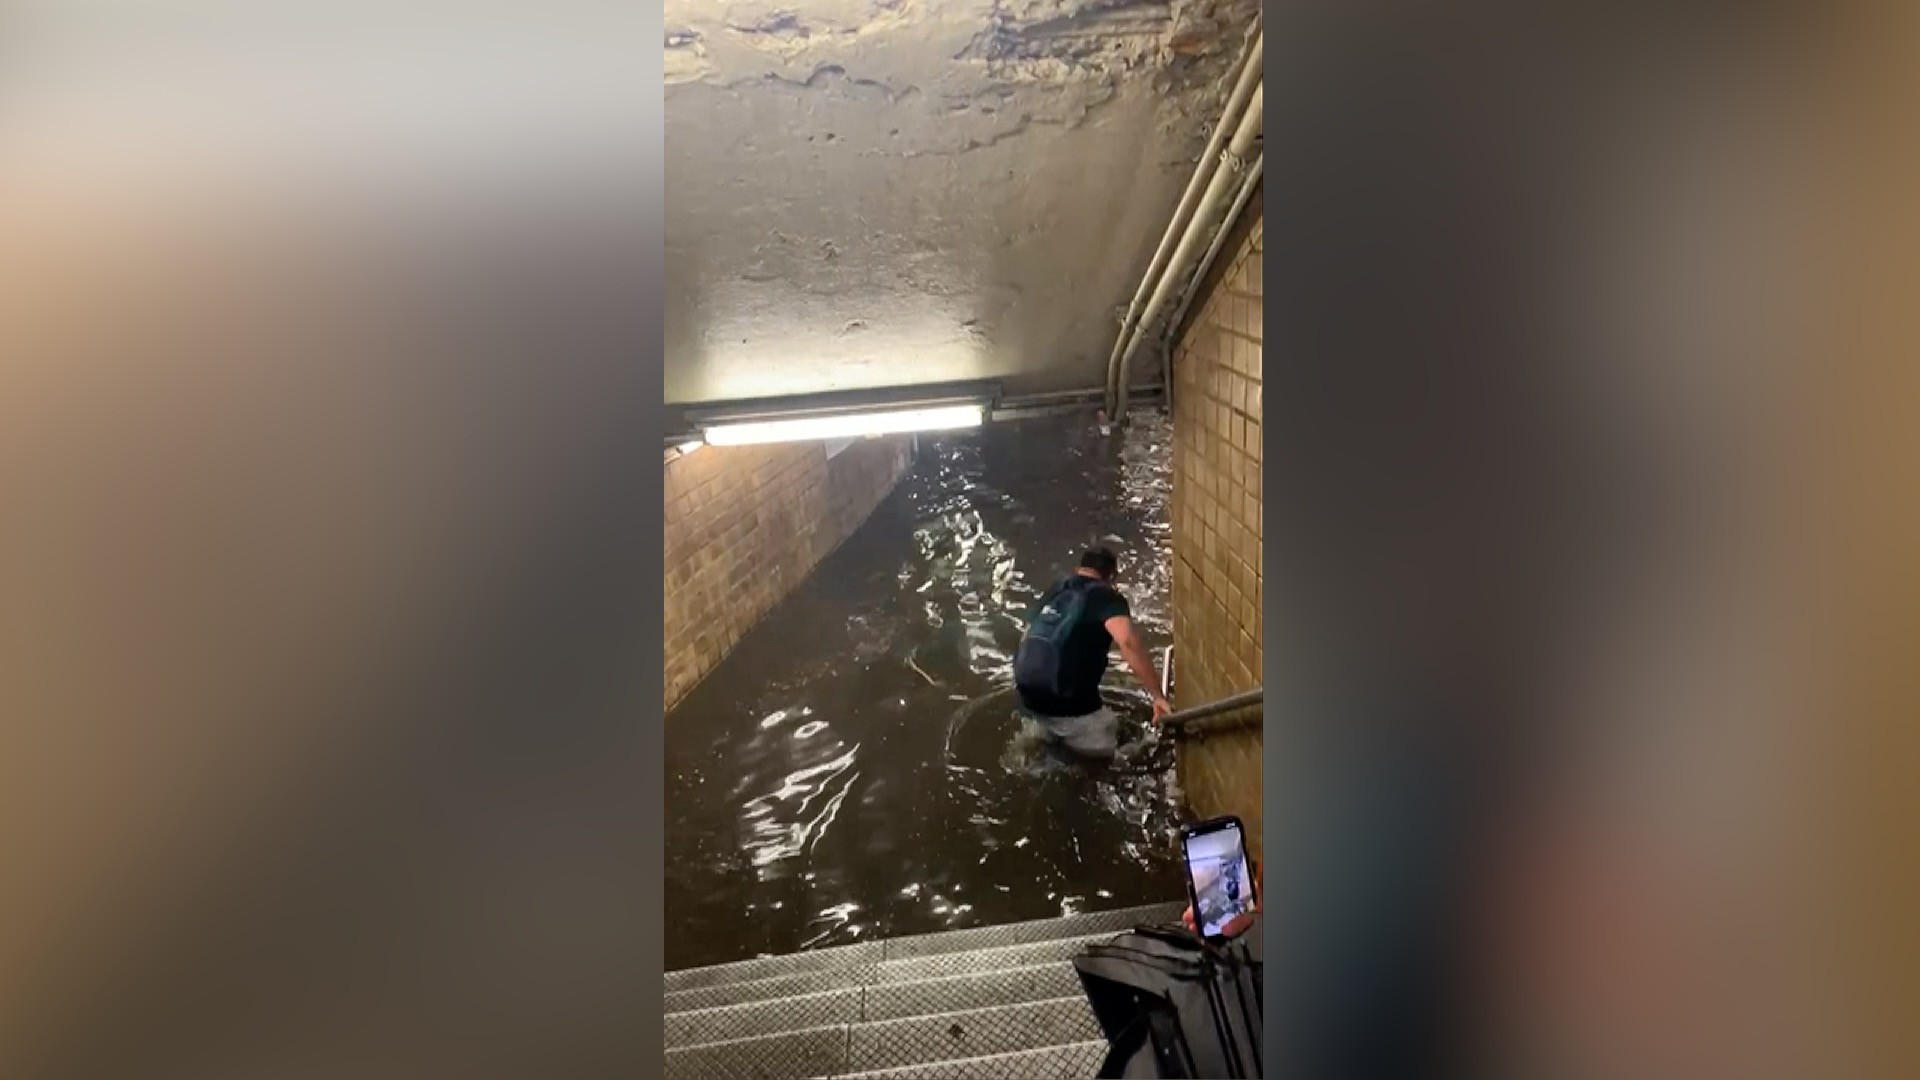
Heavy rain inundated parts of New York's subway system on Thursday afternoon, as tropical storm Elsa hammered the city. The waterlogged stations left passengers wading through filthy water.
Drainage problems are only part of longstanding problems in the city's subway system. Frequent delays and skipped stops are plaguing passengers on a daily basis.
Data shows that, in 2019, the pre-pandemic era, the city’s subway system reported an average of 45 major incidents a month, according to the Metropolitan Transportation Authority (MTA), the public transportation corporation of the city.
Major incidents are those that delay 50 or more trains, where a train is considered delayed if it is more than five minutes late or skips planned stops. In other words, approximately 2,250 trains were delayed a month.
The MTA statistics also indicate that more than half of the incidents were caused by facility breakdowns, including breakdowns of tracks, signals and subway cars. The poor condition of the public transit system is not only a problem for New York City and its subway system, but a common challenge in the U.S. transport system.
The 2021 Report Card for America's Infrastructure, an infrastructure report conducted by the American Society of Civil Engineers, shows that over a 10-year period from 2017, 36.4 percent of facilities, bus and rail maintenance buildings, 21.4 percent of systems, train control, electrification, communications and revenue collection, 18.5 percent of vehicles, 6.4 percent of fixed guideway elements, tracks, tunnels, and bus guideways, and 5.5 percent of stations were rated as in “poor” condition.
The deficient service offered by the U.S. public transit system means those who rely on it must suffer frequent disruption and inconvenience. Although the U.S. has been known as a nation on wheels, more than 40 percent of its households have only one vehicle or less and could benefit from more transit options, according to the infrastructure report.
Who are the Americans that rely on the public transit system? Pew Research Center data suggests that lower-income, Black or Hispanic, immigrants or under 50s are especially likely to use public transportation on a regular basis.
The analysis explains that Black people, Hispanics and immigrants are bigger users of public transit because they are more likely than the overall population to live in large metropolitan areas, where there tend to be more public transport options. They are also less likely to have access to an automobile than other groups and are more likely to use public transit for commuting to work.
The ongoing COVID-19 pandemic has further highlighted the struggles these groups face.
The Office of the New York State Comptroller has released a report on MTA ridership since the onset of the pandemic.
The virus hit the city in March 2020, and that corresponded with a steep drop in subway usage. Citywide, April 2020 ridership was just 8.3 percent of April 2019. Since then, New Yorkers have slowly returned to the subway system.
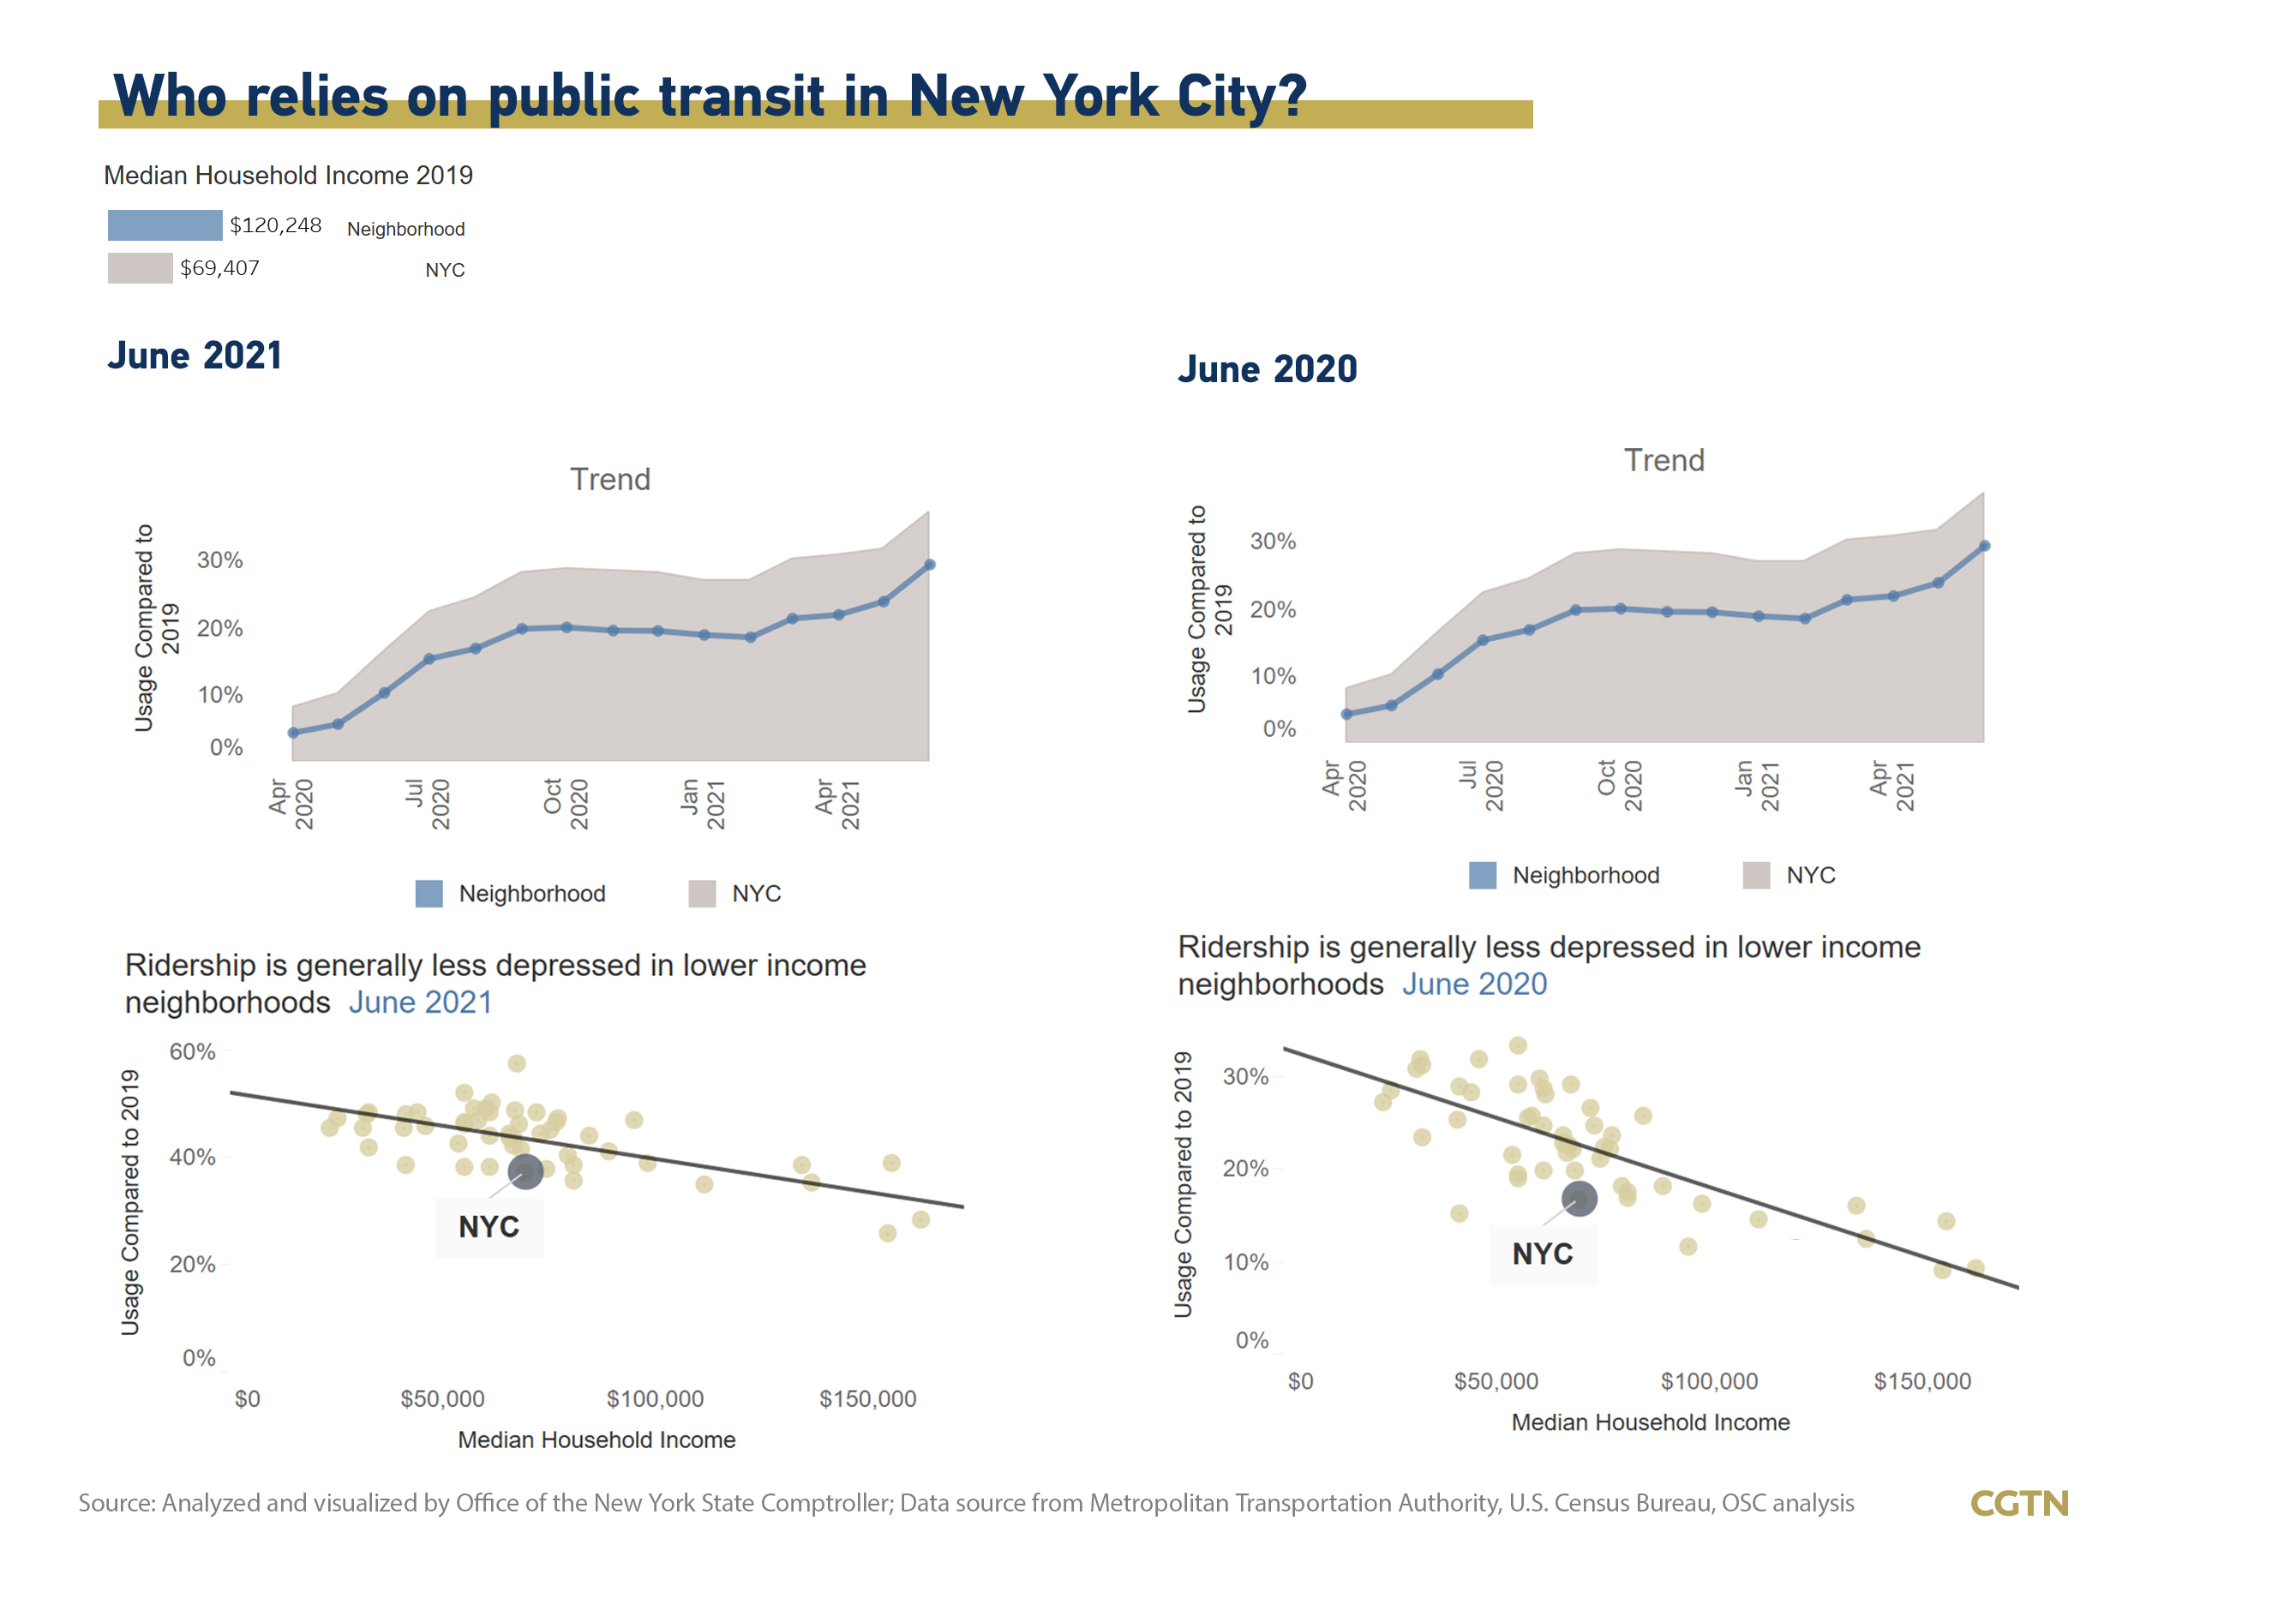
While many New Yorkers and businesses turned to telecommuting to protect themselves from the virus, others have not had that luxury. As a result, ridership as a percentage of pre-COVID levels has remained much higher in lower-income neighborhoods than in wealthy ones.
Subway turnstile data shows that neighborhoods with lower median household incomes tended to have significantly higher ridership as a share of 2019 levels compared to wealthier neighborhoods. This trend was clear not only in 2020, when COVID-19 had its most dramatic impact on ridership, but has continued through the recovery to date.
The subway system’s main transit hubs in Manhattan saw a particularly precipitous ridership drop in April, and continue to see only a fraction of pre-pandemic ridership as commuter levels remain low. Meanwhile, the stations that are recovering the fastest are predominantly located in the outer boroughs, where more immigrants and ethnic minorities live.
These groups must bear delays, cancellations and even the floods. Their patience seems limitless. Yet, behind the waiting and suppressed frustrations, are the lack of alternatives. They rely on public transit.
On June 24, U.S. President Joe Biden embraced a bipartisan Senate deal to spend hundreds of billions of dollars on infrastructure projects, building roads, bridges and highways and helping stimulate the economy.
The infrastructure plan is valued at $1.2 trillion over eight years, $579 billion of which is new spending.
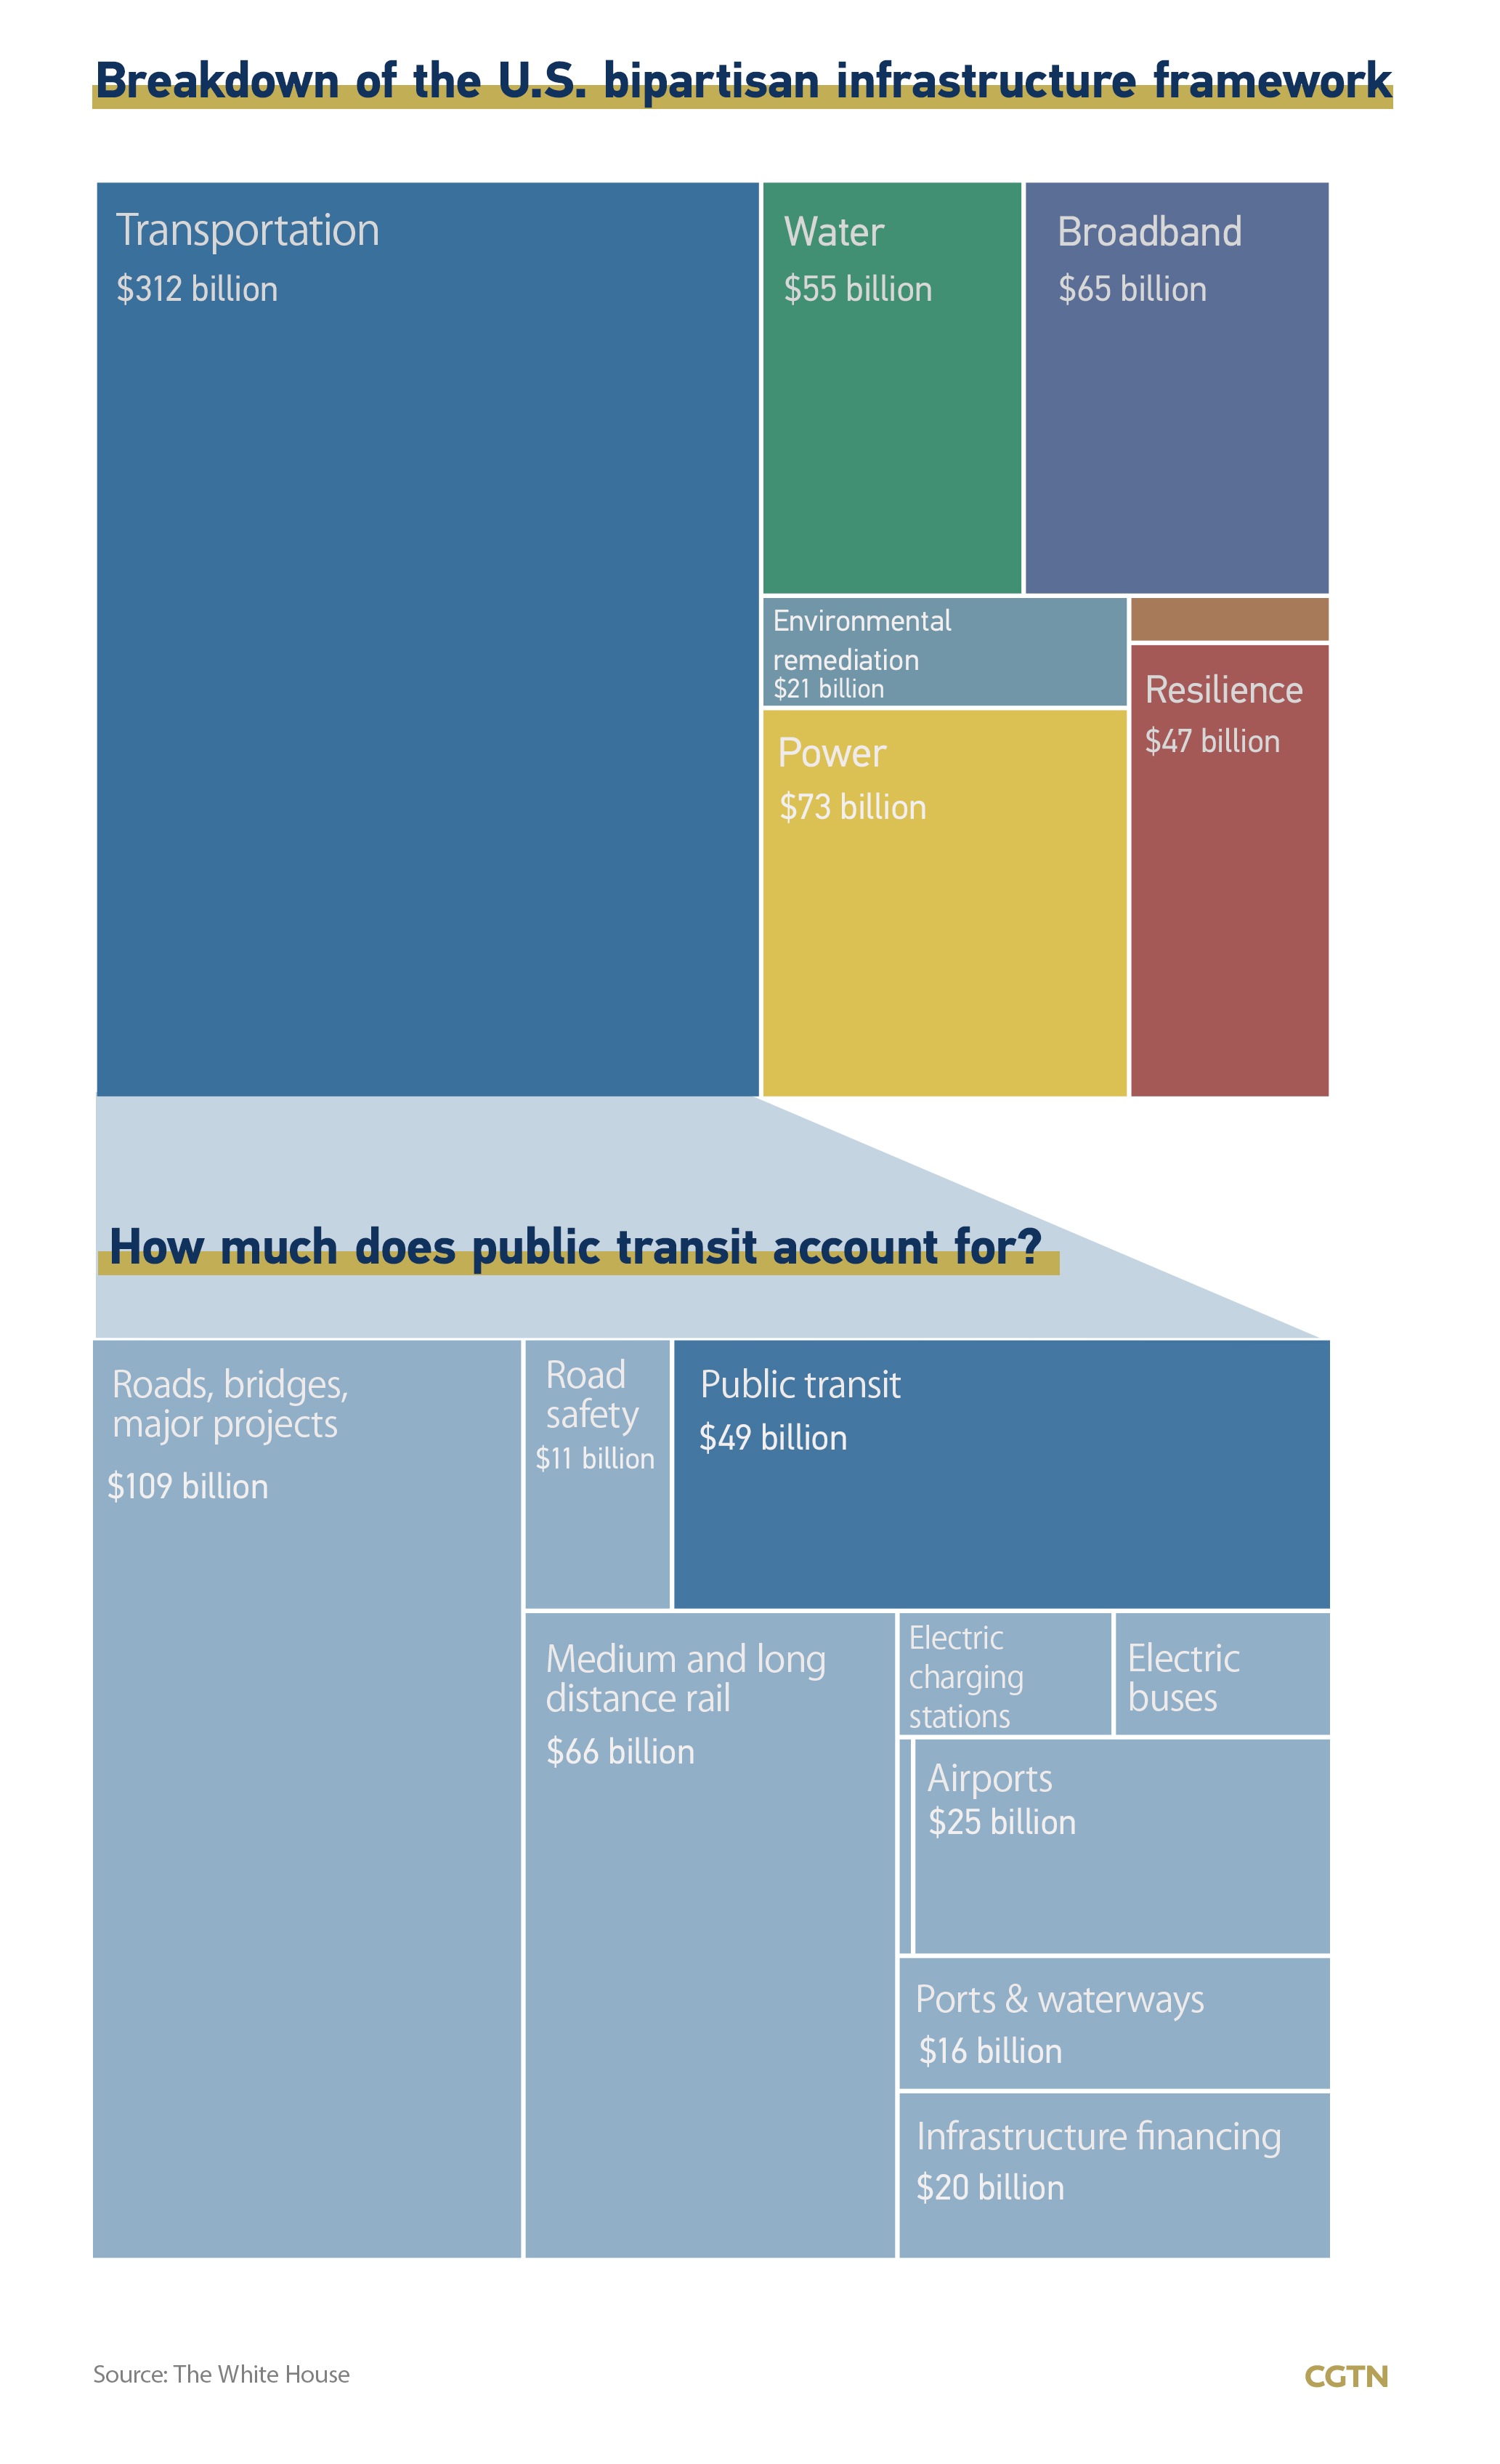
Although transportation makes up more than half of the budget, public transit only gets a tiny piece of the pie. How much will the $49 billion change the status quo?