- Home
- China
- World
- Asia-Pacific
- Americas
- Europe
- Middle-East and Africa
- Politics
- Business
- Opinions
- Tech & Sci
- Culture
- Sports
- Travel
- Nature
- Picture
- Video
- Live
- TV
- Specials
- Learn Chinese

Share

Copied

It's been a long rocky road to Tokyo. After a year-long delay due to the COVID-19 pandemic, the world's most storied showpiece event finally gets underway on Friday with athletes all over the globe hoping to add their own stories to the Olympic record books.
Though there is heightened concern among the public over the safety of holding the sporting spectacle amid rising coronavirus cases, the show will go on. And there seems to be a genuine belief that the Tokyo 2020 might serve as a symbol of recovery and solidarity.
As sports fans prepare to watch the world's finest athletes dazzle in the Japanese capital, a compelling question deserves more attention: Which powerhouses will flex their muscles in what Olympic sport?
To get a better answer, CGTN brings you an interactive guide "Summer Olympics: The biggest winners", which visualized all the gold medals awarded to athletes at past Summer Olympics according to country and region.
In order to make the data distribution more obvious, we processed the coordinate axes of the scatter plot and drew a best fit line as an output of regression analysis. Then we conducted residual analysis to find the "outliers" – where the gold medals are in the hands of relatively small number of countries. The "outliers" were highlighted on the scatter plot, and further analyzed in the second half of the project.
This interactive graphic maps all Olympic sports according to the number of gold medals given out and the number of countries and regions that have won gold. With most dots tightly clustered around the best fit line, it suggests gold medals have been consistently distributed among countries across most disciplines.
A couple of dots clearly above the line – indicating sports where medals have gone to a higher than average number of countries and regions – show that some Olympic disciplines have thrived on their unpredictability.
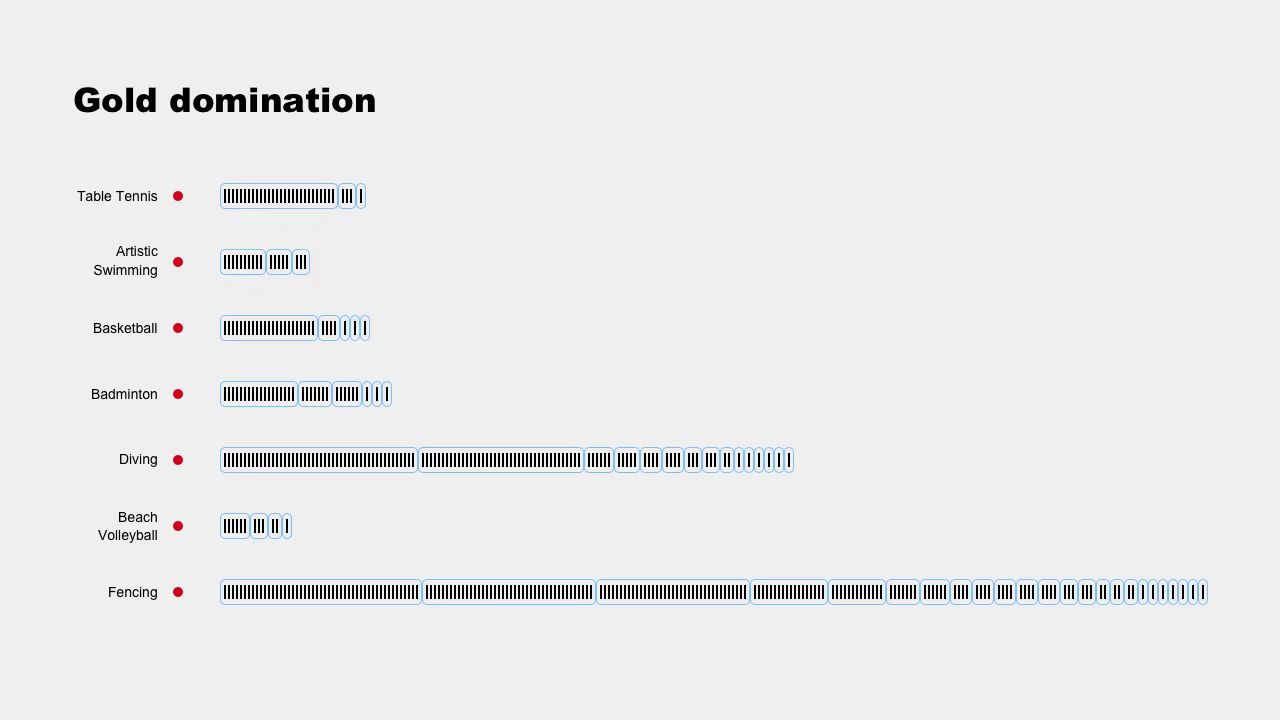
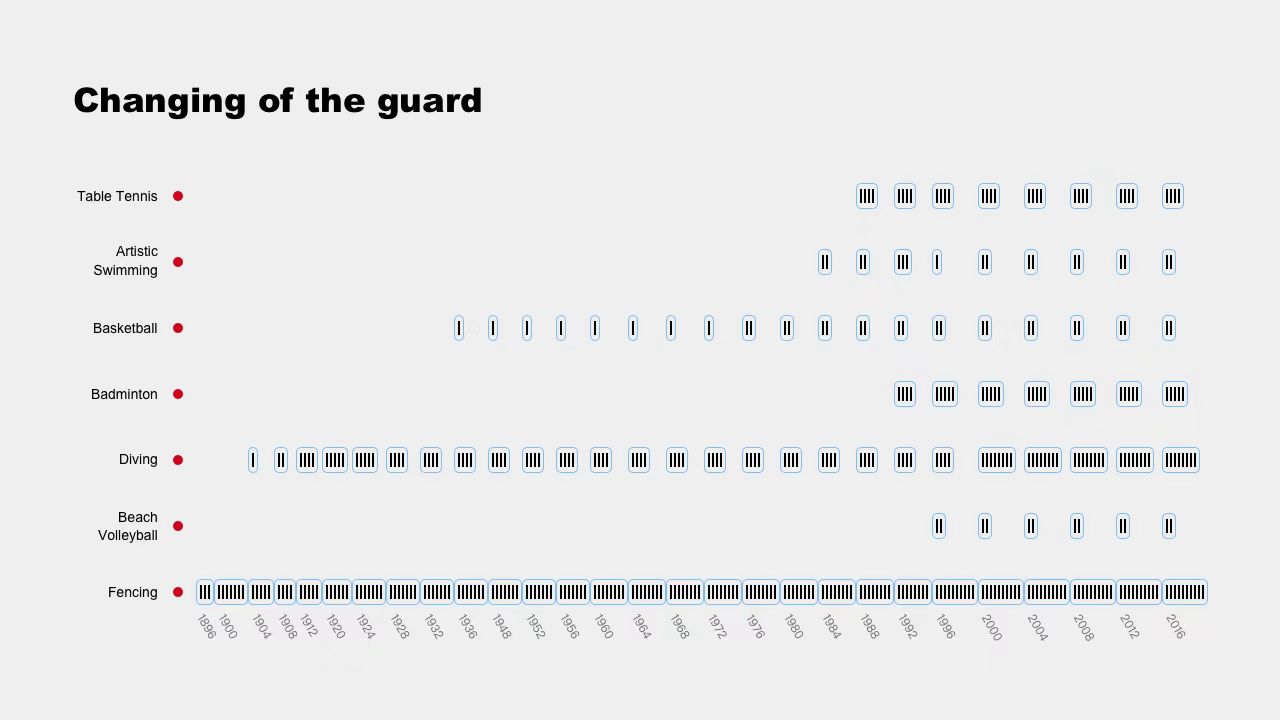
As you might expect, a handful of sports have been dominated by a specific giant. But there's no guarantee that Olympic dominance will last forever, and some events have witnessed a stunning shift in power in recent decades.
By tracking the medal count of sporting behemoths over the past century, one can chronicle the gripping history of the Games. How did "monopolies" emerge at the Games? Which countries or regions have been the most dominant? Is it possible for an Olympic minnow to clinch a large haul of golds?
The interactive will help you get a handle on the Olympic trend and get in shape for the Tokyo extravaganza.
Credits
Editors: Hu Zhicheng, Sim Sim Wissgott, John Goodrich.
Data Editors: Hu Xuechen, Shi Tao.
Data Analyst: Ou Yue.
Chief Editor: Chen Ran.
Visual Designer: Feng Yuan.
Interactive Designer: Li Yixiao.
Interactive Engineer: Zhu Sirui.
Product Manager: Hu Yiwei.
Project Coordinator: Li Jing.
Producer: Dang Zheng.
Executive Producers: Si Nan, Liu Yuqi.
Managing Director: Zhang Shilei.
Supervisors: Fan Yun, Ma Jing.