
Biz Analysis
22:47, 25-Mar-2019
What investors need to know about inverted yield curve in U.S.
Share

Copied

Editor's Note: Jimmy Zhu is chief strategist at Fullerton Markets. The article reflects the author's opinion, and not necessarily the views of CGTN.
The inversion of the U.S. Treasury yield curve on Friday caught the market's attention as the odds of a recession are increasing. However, another inversion between the U.S. 10-year yield and Fed's overnight rate, which may have been detected by many traders, may prompt the Fed to cut the rates in the near future if it is sustained.
The U.S. 10-year government bond yield dropped 15 bps last week to 2.44 percent, the biggest weekly decline since August 2015.
The sudden plunge made its level fall below the yield of its 3-month bill offers, leading to a wide discussion on whether the largest economy faces a recession ahead. However, few in the market notice that the 10-year level is also below the Fed's overnight rate at 2.50 percent.
It is the first time that the 10-year yield has moved below the benchmark interest rate since the global financial crisis more than a decade ago.
The chart below demonstrates that in the past three decades, the Fed has cut the benchmark interest rate within 15 months after the U.S. 10-year sovereign bond yield moved below the Fed's rate.
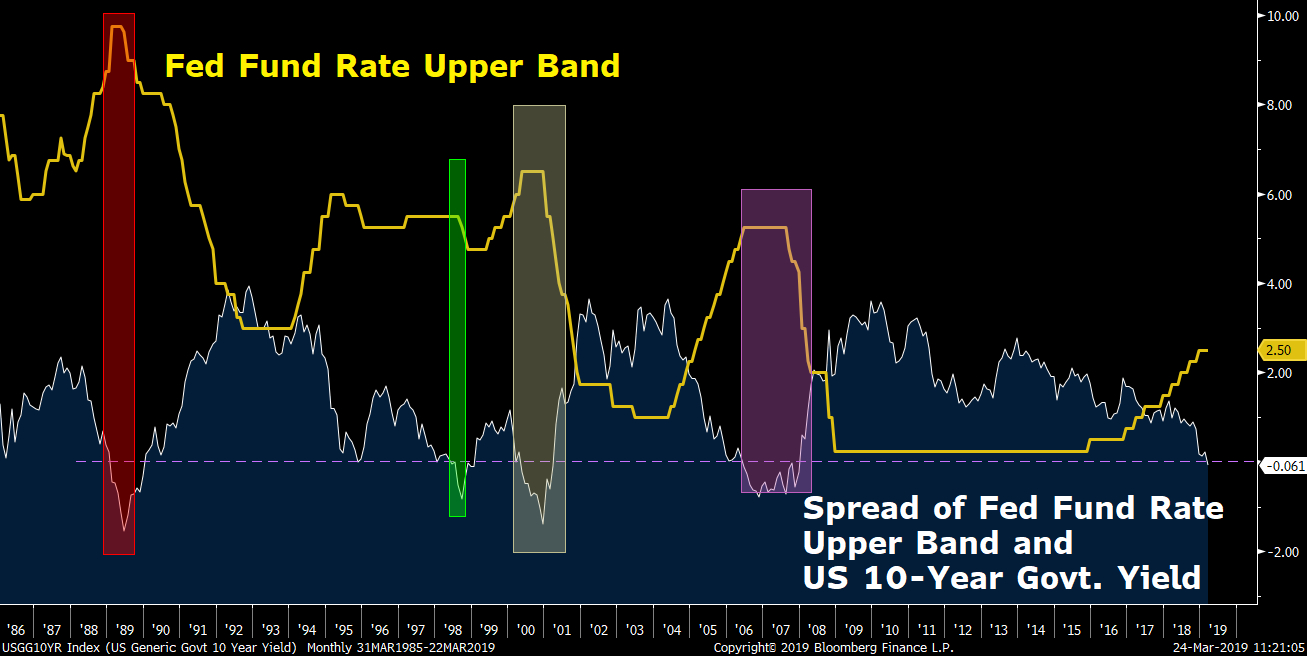
Source: Bloomberg
Source: Bloomberg
As the record shows, the first inversion within the past three decades happened in February 1989, followed by a rate cut in June in the same year.
The second inversion appeared in June 1998 and later Fed cut the interest rate in three months.
The third one came in May 2000, and then a rate cut was made in January of next year.
Another inversion happened in June 2006, followed by a rate cut in September 2007.
If this historical trend is applied to the present, it suggests that the Fed may cut the benchmark interest rate again by June next year.
If the curve inversion only lasts for a couple of days, its impact on the U.S. economy can be ignored. But three reasons behind the curve inversion this time are likely to cause “bull flattener” in curve, an environment in which long-term rates are falling faster than short-term rates.
First of all, the inversion happened just one day after the Federal Open Market Committee (FOMC) March meeting, when the committee projected no more rate hikes for this year. The Fed's cautiousness on its monetary policy obviously revealed its increasing worry about the economic outlook, inducing more inflows into the safer bonds market. (Read more: Fund manager portfolios need reshuffle after Fed meeting)
The second reason is a self-fulfilling prophecy. When a curve inversion happens, a reliable sign of a potential economic recession, bond investors may rush into buying to lock the current return as they fear the yield will decline further.
A similar phenomenon has also always happened in the currency market. For example, EUR/CHF declined almost 20 percent within one month in 2011 when this pair was closing in on the key psychological level at 1.00, as investors speculated that this key level would be broken. This pair only rose after the Swiss central bank took action on September 6. The chart below shows that the current U.S. Treasury' curve slope is pretty similar to the one in 2007 before the global financial crisis.
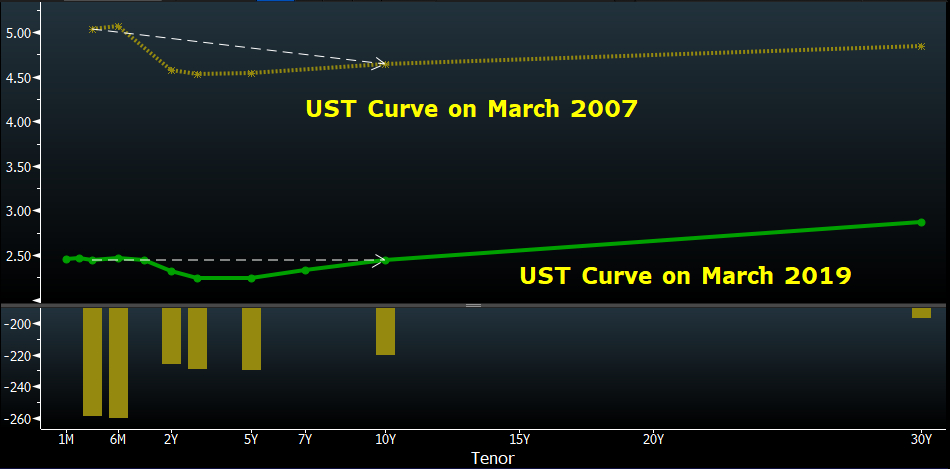
Source: Bloomberg
Source: Bloomberg
Last but not least, the eurozone's weaker economic activities will weigh on the U.S. bond yields.
Correlation between German and U.S. 10-year bond yields stood at 0.762 in the past 10 years. Thus any further decline in the Germany bond yield is likely to drag the yield in the U.S. down as well.
The regression analysis shows that bond yields in Germany may further decline after its poor manufacturing PMI data released last Friday. Meanwhile, Brexit uncertainty is another major risk to push the U.S. bond yields lower.
Risks for the U.S. bond yields to experience a further decline in the next several weeks do exist. Besides the Brexit uncertainties, European Central Bank (ECB) President Mario Draghi's speech, euro zone's inflation data, and U.S. jobs report may have substantial impacts on the U.S. bond yields.
Looking back the past five recessions since 1973, once the U.S. 3-month and 10-year bond yields inverted for a few weeks, recessions would arrive in 5 months to 1.5 years.
In other words, the longer the curve inversion endures, the higher probability of a global recession ahead.